Models, representations and spreadsheets
Lecture notes
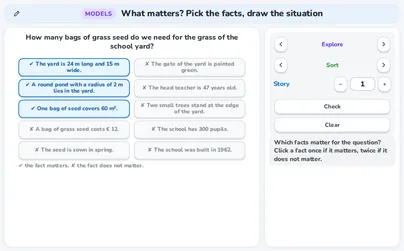
A fact matters when the question needs it
The same fact can matter for one question and not for another
Sometimes a fact is missing
Simplify: turn a plan into a model drawing
Draw: the numbers are tested, not the looks
Leave facts out on purpose
Six model families
Proportional: twice the number, twice the amount
A start amount: a straight line that misses zero
Inverse proportion: the product stays the same
Test a model: where it breaks and what it says far away
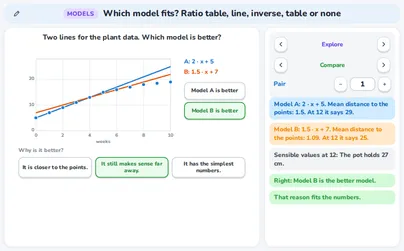
Compare two models: close to the data, sensible far away
Where does it stop? The range of a model
Six pictures for a calculation
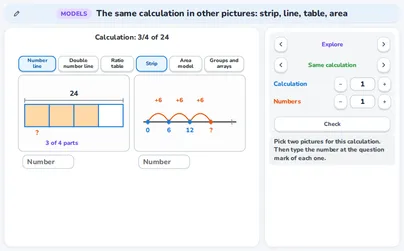
Strip: cut the whole into equal parts
Double number line and ratio table: percentages
Number line: jumps to the right and to the left
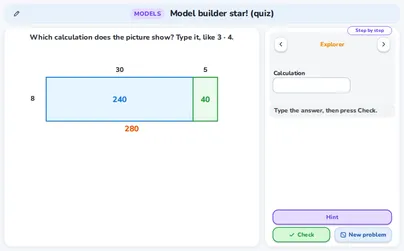
Area model: cut a number at a friendly place
Pick the picture that fits the calculation
Draw your own, and swap: pictures are for sharing
A small spreadsheet: cells, formulas and the formula bar
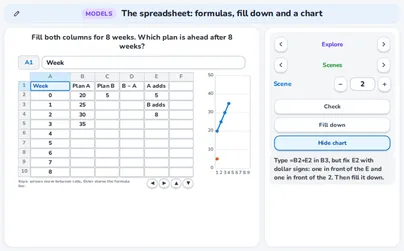
Fill down: the row numbers move with the cell
A fixed cell: a dollar sign keeps it in place
The functions have the names of the page language
Charts: a bar chart and a line chart
Predict first, then let the sheet show it
A sheet does not know what you meant
A text in a list, a range that misses a row, a fixed cell too many
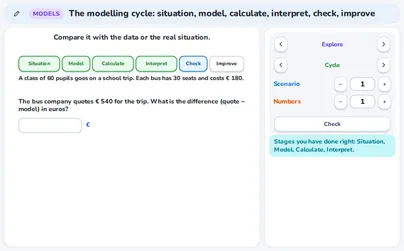
The modelling cycle: six stages
Interpret: a number alone does not answer the question
Check shows the flaw of the first model
Improve and run the cycle again
Stop after any stage, and name the stages you did right
The quiz: all five applications mixed
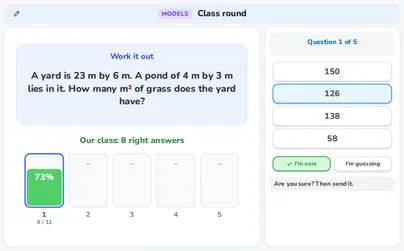
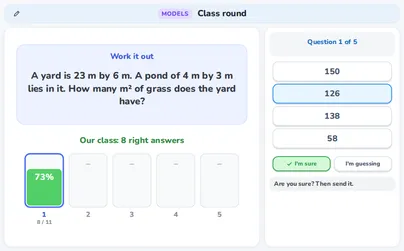
The class round: the whole class at once
Keys, and nothing is sent anywhere
Exercises
Show solution
Show solution
Show solution
Show solution
Show solution
Show solution
Show solution
Show solution
Show solution
Show solution
Show solution
Show solution
Show solution
Show solution
Show solution
Interactive applications for this topic
Free applications open with a free student account. Teachers can use all applications in a live lesson.
FreeWhat matters? Pick the facts, draw the situation
PlusWhich model fits? Ratio table, line, inverse, table or none
PlusThe same calculation in other pictures: strip, line, table, area
PlusThe spreadsheet: formulas, fill down and a chart
PlusThe modelling cycle: situation, model, calculate, interpret, check, improve
PlusModel builder star! (quiz)
PlusModel builder star! (quiz), primary school edition
PlusClass round: the whole class at once
PlusClass round, primary school edition: the whole class at once Start live lessons with these applications for your whole class. Free to try for one month.
Try it freeFits these school years
IB (MYP, Diploma): MYP 1, MYP 2, MYP 3, MYP 4
Cambridge International: Lower Secondary, stage 7, Lower Secondary, stage 8, Lower Secondary, stage 9, IGCSE
Netherlands: Groep 7, Groep 8, Year 1, Year 2, Year 3 (havo, vwo), Vmbo kb (years 3-4), Vmbo gt (years 3-4), Vmbo bb (years 3-4), Havo · Mathematics A, Havo · Mathematics B, Vwo · Mathematics A, Vwo · Mathematics B, Vwo · Mathematics C
Türkiye (MEB): Year 5 (MEB), Year 6 (MEB), Year 7 (MEB), Year 8 (MEB), Year 9 (MEB)
England (GCSE, A Level): Year 7, Year 8, Year 9, Year 10 (GCSE)
USA (Common Core): Grade 6, Grade 7, Grade 8, Algebra 1
What the applications of this topic teach 7 applications
What matters? Pick the facts, draw the situation
- Telling which facts of a story matter for the question
- Turning a plan into a model drawing and finding its area
- Drawing a situation on a grid with the numbers that matter
Which model fits? Ratio table, line, inverse, table or none
- Choosing a model from the numbers: ratio table, line, inverse
- Testing a straight line against data
- Comparing two models and where a model stops making sense
The same calculation in other pictures: strip, line, table, area
- Showing one calculation in several pictures: line, table, strip, area
- Reading the calculation and result from a picture
- Drawing a picture for a calculation with the right numbers
The spreadsheet: formulas, fill down and a chart
- Typing numbers and formulas in a sheet and reading cells by name
- Filling a formula down and keeping one cell fixed
- Making a chart from the cells of a sheet
The modelling cycle: situation, model, calculate, interpret, check, improve
- Naming the six stages of the modelling cycle
- Calculating with a model and stating the result in context
- Checking a model against data and improving it
Model builder star! (quiz), primary school edition
- Answer questions on the 2 applications of this edition: the facts that matter and the same calculation in more than one picture.
Class round, primary school edition: the whole class at once
- I know what a model is and what a relevant fact is.
- I know how a ratio table and a strip work.
- I know that more facts do not always make a better model and that the same calculation can be drawn in more than one way.