A normal variable X has a bell-shaped, symmetric curve. Two numbers fix it: the meanμ (the centre) and the standard deviationσ (the spread). We write X∼N(μ,σ2); the second number is the variance σ2.
Example
Adult heights in a town have mean 170 cm and standard deviation 8 cm.X∼N(170,82): the curve is highest at 170 and falls away on both sides, most of the people are within 16 cm of the mean.
Definition
Symmetry and area 1
The curve is symmetric about x=μ: the mean, the median and the mode are all equal to μ, and half of the values lie on each side. The whole area under the curve is 1 (the total probability), whatever μ and σ are.
Example
Heights, X∼N(170,82): P(X<170)=0.5.162 and 178 are both 8 cm from the mean, so P(X<162)=P(X>178)≈0.1587.
Rule
The mean moves, the spread stretches
A different μmoves the curve along the axis; its shape stays. A larger σstretches it: wider and lower. The area stays 1, so the peak height is f(μ)=σ2π1.
Example
N(100,152) has peak height 152π1≈0.0266.With σ=30 (orange) the curve is twice as wide and the peak is half as high: ≈0.0133.
Rule
Points of inflection at μ ± σ
In the middle the curve bends downward, in the tails upward. It changes its bend at the two points of inflectionx=μ−σ and x=μ+σ. So you can read σ off a picture: it is the distance from the centre to where the curve starts to bend the other way.
Example
N(60,52) bends at 55 and 65.There the height is the peak times e−1/2: f(55)=f(65)=0.0798⋅0.6065≈0.0484.
Rule
The rule of thumb 68 – 95 – 99.7
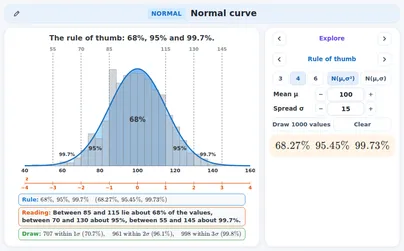
For a normal distribution about 68% of the values lie within one standard deviation of the mean, about 95% within two and about 99.7% within three. Almost nothing lies further out than μ±3σ.
Example
Heights, N(170,82):between 162 and 178 about 68%; between 154 and 186 about 95%; between 146 and 194 about 99.7%.Of 1000 people about 950 are between 154 and 186 and about 50 are outside.
Tip
The exact shares
The rule of thumb is rounded. The exact shares are 68.27%, 95.45% and 99.73%. For exactly 95% you need 1.96 standard deviations, not 2; for 99% you need 2.576.
Example
Within two standard deviations lies 0.9545, so of 1000 people on average 954.5 and not exactly 950.And P(−1.96<Z<1.96)≈0.95: that is where the 1.96 comes from.
Definition
Fitting a normal curve to data
To model data with a normal curve, take the meanxˉ of the data as μ and the standard deviations of the data as σ. The curve N(xˉ,s2) should then follow the tops of the histogram bars.
Example
Twelve heights (cm): 160,163,165,167,168,169,171,172,173,175,177,180.Sum 2040, so xˉ=2040/12=170. Squared distances: 376, so s2=376/11≈34.18, s≈5.85.
Rule
Sample or whole group: n − 1 or n
There are two standard deviations. For a sample from a larger group divide by n−1: s=n−1∑(x−xˉ)2. For the whole group divide by n: σ=n∑(x−μ)2. For a large n they are almost equal.
Example
The twelve heights as a sample: s=376/11≈5.85.As a whole group: σ=376/12≈5.60.With n=100 the two differ by only about 0.5%.
Tip
Check the fit with the bands
Count how many values lie within one and within two standard deviations of the mean. For data from a normal distribution that is about 68% and about 95%. If the shares are far off, or the histogram is clearly lopsided, doubt the model.
Example
The twelve heights, xˉ=170, s=5.85:within one standard deviation (164.15 to 175.85) lie 8 of 12 values, that is 67% (rule: 68%);within two all 12, that is 100% (rule: 95%). The fit is good.
Watch out!
When a normal model is not appropriate
Do not use a normal curve when the data are clearly skewed, have two peaks, run into a hard limit that the curve would cross, or are too few to judge. A quick test: xˉ−2s must not fall below a hard limit such as 0.
Example
Twelve reaction times (s): 0.18,0.19,0.20,0.21,0.22,0.23,0.25,0.28,0.33,0.41,0.55,0.72.Mean 0.31, s≈0.17, so xˉ−2s≈−0.02: below 0, but a time cannot be negative. The median 0.24 lies below the mean: skewed to the right. A normal model is not appropriate.
Definition
A continuous variable: probability is area
A continuous variable, such as a height, can take every value in an interval. The probability that X lies between a and b is the area under the curve from a to b: P(a<X<b).
Example
Heights, X∼N(170,82): the area between 165 and 175 is P(165<X<175)≈0.4680.So about 47% of the people are between 165 and 175 cm.
Rule
One value has probability 0
For a continuous variable P(X=a)=0: one value has no width, so no area. Hence P(X<a)=P(X≤a) and P(X>a)=P(X≥a): the end points do not matter. For a discrete variable such as a binomial one they do.
Example
X∼N(170,82): P(X≤178)=P(X<178)≈0.8413.But X∼B(10,0.5): P(X≤5)≈0.6230 and P(X<5)≈0.3770; the value 5 itself has probability 0.2461.
Rule
Four kinds of area
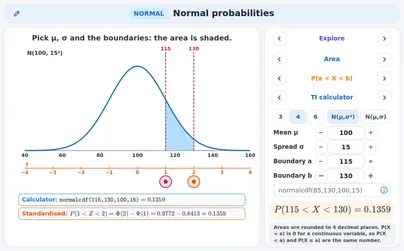
A normal probability is one of four areas: the left tailP(X<a), the right tailP(X>a)=1−P(X<a), the area betweenP(a<X<b) and the two tailsP(X<a)+P(X>b)=1−P(a<X<b). Always draw the curve and shade the area first.
Example
A test score has X∼N(100,152).P(X<115)≈0.8413, P(X>115)≈0.1587, P(85<X<130)≈0.8186 and the two tails P(X<85)+P(X>130)=1−0.8186≈0.1814.
Rule
The calculator line
A graphing calculator gives the area directly. The arguments are lower limit, upper limit, mean and standard deviation: TInormalcdf, CasioNormCD (there the standard deviation comes before the mean). For an open end type -1E99 or 1E99.
Example
X∼N(100,152) and P(X<115):TI normalcdf(-1E99, 115, 100, 15), Casio NormCD(-1E99, 115, 15, 100); the answer is 0.8413.P(X>115): normalcdf(115, 1E99, 100, 15) gives 0.1587.
Rule
Standardising: z and Φ
Every normal curve becomes the standard normal curve N(0,1) when you standardise: Z=σX−μ. Then P(X<a)=Φ(z) with z=σa−μ, where Φ(z)=P(Z<z) is the area of the standard normal curve to the left of z.
Example
X∼N(100,152), P(X<115): z=15115−100=1, so P(X<115)=Φ(1)≈0.8413.The same area, only the axis changed: below the x axis stands the z axis.
Definition
The z-score
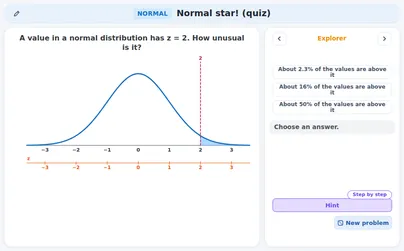
The z-scorez=σx−μ tells how many standard deviations x lies from the mean: positive above, negative below. Back: x=μ+zσ.
Example
X∼N(100,152): x=130 has z=15130−100=2: two standard deviations above the mean.z=−1.4 gives x=100+(−1.4)⋅15=79.
Definition
The printed table of Φ(z)
A printed table gives Φ(z)=P(Z<z) to 4 decimals for z=0.00,0.01,0.02,…. Find the row of z to one decimal and the column of the second decimal; the number where they meet is Φ(z).
Example
Φ(1.26): row 1.2, column 0.06: Φ(1.26)≈0.8962.
Rule
Negative z and the symmetry rule
The table has only z≥0. For a negative z use the symmetry: Φ(−z)=1−Φ(z). Also P(Z>z)=1−Φ(z) and P(a<Z<b)=Φ(b)−Φ(a).
Example
P(Z<−1.26)=1−0.8962=0.1038, and P(Z>1.26) is the same by the mirror.For N(100,152) that is P(X<81.1), because 100−1.26⋅15=81.1.Between: P(0.5<Z<1.5)=0.9332−0.6915=0.2417.
Watch out!
The last digit may differ
Every table entry is rounded to 4 decimals. A result built from two entries can therefore differ in the last digit from the calculator value. Both are right to that accuracy: give 4 decimals and do not round further.
Example
X∼N(100,152), P(85<X<130): z=−1 and z=2.Table: 0.9772−0.1587=0.8185.Calculator normalcdf(85, 130, 100, 15): 0.8186, because 0.97724987−0.15865525=0.81859461.
Rule
Add columns for the third decimal
Some formula booklets (such as the MF19 of Cambridge 9709) give Φ(z) for two decimals of z and an ADD block for the third decimal. Take the entry for the first two decimals and add the number of the third decimal from the ADD block (in units of 0.0001).
Example
Φ(1.264): the entry for 1.26 is 0.8962; in row 1.2 the third decimal 4 adds 7 (that is 0.0007).Φ(1.264)≈0.8962+0.0007=0.8969.Where the 7 comes from: from z=1.2 to 1.3 the entry rises by 0.9032−0.8849=0.0183; the third decimal 4 is 0.04 of that step: 0.0183⋅0.04=0.000732≈0.0007.
Rule
Two tails and the critical values
P(∣Z∣>z)=2(1−Φ(z)) is the area of both tails together. The values you meet most: z=1.645 leaves 10% in the two tails, z=1.96 leaves 5% and z=2.576 leaves 1%.
Example
P(∣Z∣>1.96)≈0.05: 2.5% in each tail.For N(100,152): P(∣X−100∣>30)=2(1−Φ(2))≈0.0455, the same as P(X<70)+P(X>130).
Rule
Comparing with z-scores
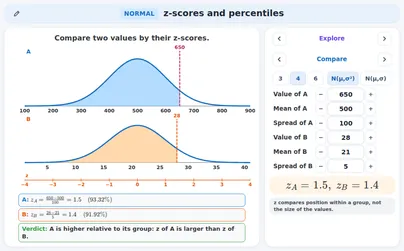
Values on different scales cannot be compared directly. Standardise both: the larger z is the better position within its own group. A z-score compares relative position, not size.
Example
A scores 650 on a test with mean 500 and standard deviation 100: z=1.5.B scores 28 on a test with mean 21 and standard deviation 5: z=1.4.A stands higher: 93.3% of the group of A scored lower, against 91.9% for B.
Definition
Percentile rank and the value at a percentile
The percentile rank of x is the share of the values below it: Φ(z)⋅100%. The other way round, the value at the p-th percentile is x=μ+zpσ with Φ(zp)=p/100. A percentile is not a percentage of right answers.
Example
z=1.5 gives Φ(1.5)≈0.9332: the 93rd percentile (93.3% lie below).The 90th percentile of N(100,152): z=1.2816, so x=100+1.2816⋅15≈119.2.A mark 72 on a test with mean 75 and standard deviation 10 has z=−0.3: only 38.2% of the group is lower, although 72% is right.
Definition
The inverse normal
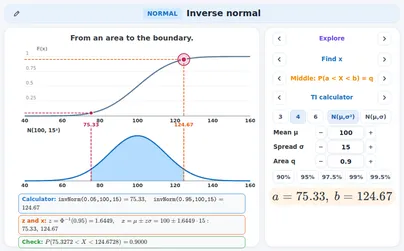
The inverse normal goes from an area to a boundary: given P(X<a)=q, find a. A calculator does it in one line (invNorm on a TI, InvN on a Casio). With a table read Φ(z)=q backwards and use a=μ+zσ.
Example
X∼N(100,152) and P(X<a)=0.9.Table: Φ(z)=0.9 gives z≈1.2816, so a=100+1.2816⋅15≈119.22.Calculator: invNorm(0.9, 100, 15) gives 119.22. Check: P(X<119.22)=0.9.
Rule
Inverse: left, right and middle
The inverse normal always needs the left area. Right tail P(X>a)=q: use the left area 1−q. Middle P(a<X<b)=q, symmetric about μ: each tail holds 21−q, so b has left area 21+q and a=2μ−b.
Example
Heights, N(170,82).The tallest 10%: left area 0.9, z=1.2816, a=170+1.2816⋅8≈180.25 cm.The middle 90%: left area 0.95, z=1.645, so 170±1.645⋅8: from 156.84 to 183.16 cm.In the table 0.9 lies between 0.8997 (z=1.28) and 0.9015 (z=1.29).
Rule
One unknown: μ or σ
When μ or σ is unknown, one condition fixes one unknown. Turn P(X<a)=q into a z-value with the inverse normal, then solve a=μ+zσ for the unknown: μ=a−zσ or σ=za−μ.
Example
σ=10 and P(X<40)=0.2: the left area 0.2 gives z=−0.8416, so μ=40−(−0.8416)⋅10≈48.42.If instead μ=50 is known: σ=−0.841640−50≈11.88.
Rule
Two unknowns: two equations
Two conditions give two equations a=μ+z1σ and b=μ+z2σ. Subtract them: σ=z2−z1b−a, then μ=a−z1σ. Always check by putting the answers back into the two conditions.
Example
P(X<40)=0.2 and P(X<55)=0.9.z1=−0.8416 and z2=1.2816, so σ=1.2816+0.841655−40=2.123215≈7.065.μ=40+0.8416⋅7.065≈45.95. Check: P(X<40)=0.2 and P(X<55)=0.9.
Rule
The middle interval: 1.96σ or 2σ
The middle interval that holds a share q is μ±cσ, where c is the z with left area 21+q: c=1.645 for 90%, 1.96 for 95%, 2.576 for 99%. The “two sigma” of the rule of thumb is a round 1.96: it holds 95.45%.
Example
N(100,152), the middle 95%: 100±1.96⋅15=100±29.4, from 70.6 to 129.4.With “two sigma” the interval is 70 to 130, which holds 0.9545.
Definition
The normal approximation of the binomial
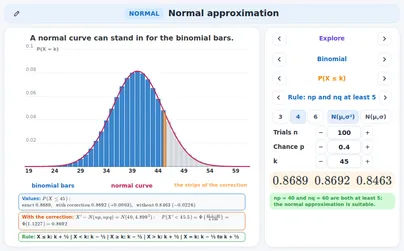
For a large n the bars of B(n,p) form a bell. The normal curve with the same mean and variance fits them: B(n,p)≈N(np,npq) with q=1−p. The standard deviation is npq.
Example
X∼B(100,0.4): the mean is np=100⋅0.4=40, the variance npq=100⋅0.4⋅0.6=24, the standard deviation 24≈4.899.So use N(40,24).
Rule
When is the approximation good?
The bars must not be lopsided: np and nq both at least 5 (take 10 to be safe). Otherwise the error is large and you use the exact binomial. A measure is the largest difference between the exact and the approximate P(X≤k) over all k.
Example
B(100,0.4): np=40 and nq=60, both large: the largest error is only 0.0027.B(30,0.05): np=1.5 and nq=28.5: the first is below 5, the largest error is 0.0535, twenty times as big. Use the exact binomial here.
Rule
The continuity correction
The bar of k covers k−0.5 to k+0.5. So P(X≤k) is approximated by the normal area left of k+0.5, not left of k. The extra half-unit strip is what the continuity correction adds.
Example
B(100,0.4), P(X≤45): exact ≈0.8689.With the correction: z=2445.5−40≈1.1227, Φ(z)≈0.8692 (error 0.0003).Without: z=2445−40≈1.0206, Φ(z)≈0.8463 (error 0.0226).The strip from 45 to 45.5 has area ≈0.0229.
Rule
The correction for every event
Write the event with ≤ or ≥ first (X<k is X≤k−1, X>k is X≥k+1). The corrected boundary lies half a unit outside the last value included: X≤k: to k+0.5; X≥k: from k−0.5; X=k: k−0.5 to k+0.5; a≤X≤b: a−0.5 to b+0.5.
Example
B(100,0.4), N(40,24):P(X>45)=P(X≥46): from 45.5: exact 0.1311, normal 0.1308.P(38≤X≤42): 37.5 to 42.5: exact 0.3899, normal 0.3902.A common slip: P(X<45)=P(X≤44) needs 44.5 (normal 0.8208, exact 0.8211); 45.5 would give 0.8692, that is P(X≤45).
Rule
A linear function of a normal variable
If X∼N(μ,σ2), then aX+b is normal again, with mean aμ+b and standard deviation ∣a∣σ (variance a2σ2). The bell is moved and stretched, never bent out of shape.
Example
A temperature in °C is X∼N(20,32). In °F it is F=1.8X+32: mean 1.8⋅20+32=68, standard deviation 1.8⋅3=5.4, so F∼N(68,5.42).P(F>75): z=5.475−68≈1.296, so ≈0.0974; the same as P(X>23.89).
Rule
Sums of independent normals
If X and Y are independent and normal, then X+Y is normal with mean μX+μY and variance σX2+σY2. In general aX+bY has mean aμX+bμY and variance a2σX2+b2σY2.
Example
X∼N(5,22) and Y∼N(3,1.52) are independent.Mean 5+3=8, variance 4+2.25=6.25, so X+Y∼N(8,2.52).P(X+Y<10)=Φ(2.510−8)=Φ(0.8)≈0.7881.
Watch out!
Variances add, standard deviations do not
Add the variances, never the standard deviations. For a difference X−Y the variances also add: σX2+σY2, while the mean is μX−μY. A difference is never less spread out than its parts.
Example
Same X and Y: the standard deviation of X+Y is 2.5, not 2+1.5=3.5. With 3.5 you would find P(X+Y<10)≈0.7161 instead of 0.7881.X−Y∼N(2,2.52), so P(X<Y)=P(X−Y<0)=Φ(−0.8)≈0.2119.
Tip
Which model fits?
Check the situation before you calculate. Binomial: a fixed number of independent trials, success or failure, the same chance each time. Normal: a measurement or a sum that is symmetric, has one peak and no hard limit. A binomial with np and nq at least 5 is both.
Example
Heads in 50 coin tosses: binomial, and np=nq=25, so also nearly normal.Waiting time for a bus: not normal (skewed, hard limit at 0).A guessed test of 20 questions with 4 choices: binomial with np=5 and nq=15, just at the border; the largest error of the approximation is 0.0167.Adult heights: normal.
Tip
Everyday: heights
Read the words: “the tallest 10%” is a right tail and needs the inverse normal; “taller than a door” is a right-tail area; “between two heights” is an area between. Give the answer in a sentence with the unit.
Example
Heights, N(170,82).The tallest 10% start at 180.25 cm (left area 0.9).Taller than a door of 190 cm: z=2.5, P(X>190)≈0.0062: about 0.62% of the people.
Tip
Everyday: the filling machine
A machine fills bottles with a mean setting and a spread σ. The share under the label volume is a left tail. To keep at most a share q under the label, raise the mean setting to μ=label+zσ, or reduce σ.
Example
Label 500 ml, σ=4 ml. At mean 502: z=−0.5 and P(X<500)≈0.3085, about 31% under the label.For at most 2.5% under: μ=500+1.96⋅4=507.84 ml. With σ=2 it is 503.92 ml.
Tip
Everyday: exam grades
A mark’s percentile rank is Φ(z)⋅100%; a mark at a given percentile needs the inverse normal; a pass mark gives the share that passes as a right tail.
Example
Marks N(62,122).Mark 80: z=1.5, percentile rank 93.3.The 85th percentile: 62+1.0364⋅12≈74.44.Pass mark 55: z=−0.5833 and P(X≥55)≈0.7202: about 72% pass.
Tip
Everyday: shaft tolerance
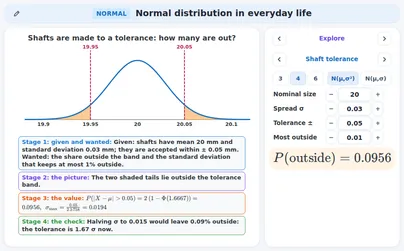
A part is good when its size lies in the tolerance band μ±t. The share outside is two tails: 2(1−Φ(t/σ)). For at most a share q outside choose σ with t/σ=z, where z has left area 1−q/2.
Example
A shaft of nominal diameter 20 mm, σ=0.02 mm, tolerance ±0.03 mm: z=1.5 and the share outside is 2(1−Φ(1.5))≈0.1336, about 13%.For at most 1% outside: z=2.576, so σ≤2.5760.03≈0.0116 mm. Check: σ=0.0116 gives 0.0097.
Tip
Which course asks what
Cambridge 9709: the normal distribution with tables (Paper 5), the approximation with continuity correction, sums of normals (Paper 6). UK A level (DfE, Edexcel, AQA): the normal as a model and choosing the distribution. IB (AA, AI): curve, standardising, inverse normal, unknown mean or standard deviation; sums of normals in AI HL. AP Statistics: z-scores, the empirical rule, areas and intervals. Common Core: fit a normal curve to data. Netherlands: the three rules of thumb (wiskunde A havo), the standard normal (wiskunde D vwo).
Example
A typical exam question: X∼N(50,82); find P(X>62) and the value a with P(X<a)=0.95.z=862−50=1.5, so P(X>62)=1−0.9332=0.0668; and a=50+1.645⋅8=63.16.
Exercises
Heights in a village: X∼N(172,72) (cm). Give the mean, the standard deviation, the two points of inflection and P(X<172). Easy
Show solution
Mean μ=172, standard deviation σ=7 (the variance is 72=49).
The points of inflection are at μ±σ: 165 and 179.
By symmetry half of the area lies to the left: P(X<172)=0.5.
Mean 172, standard deviation 7, bends at 165 and 179, P(X<172)=0.5
Check → 165 and 179 are both 7 away from 172.
The marks of a test are X∼N(70,62). Use the rule of thumb: between which marks do about 95% of the pupils lie? About what share scores more than 88? Easy
Show solution
About 95% lie within 2 standard deviations: 70±12, from 58 to 82.
About 99.7% lie within 3: 70±18, from 52 to 88. So 0.3% lie outside and half of it, about 0.15%, above 88.
From 58 to 82; about 0.15% score above 88
Check → the exact value is P(X>88)≈0.0013, about 0.13%: close to the rule of thumb.
X∼N(65,82). Find the z-score of x=77, and the value x that has z=−0.5. Easy
Show solution
z=σx−μ=877−65=812=1.5.
x=μ+zσ=65+(−0.5)⋅8=65−4=61.
z=1.5 and x=61
Check → 77 is 1.5 standard deviations (12) above 65; a negative z gives a value below the mean.
X∼N(50,82). Find P(X<62) with the table of Φ(z). Easy
Show solution
Standardise: z=862−50=1.5.
In the table: row 1.5, column 0.00: Φ(1.5)=0.9332.
So P(X<62)=Φ(1.5)≈0.9332. (The single value 62 has probability 0, so < or ≤ gives the same.)
P(X<62)≈0.9332
Check → 62 lies above the mean 50, so the answer is above 0.5.
Use the table of Φ(z): find Φ(0.83), P(Z>0.83) and P(Z<−0.83). Easy
Show solution
Row 0.8, column 0.03: Φ(0.83)=0.7967.
P(Z>0.83)=1−Φ(0.83)=1−0.7967=0.2033.
By symmetry P(Z<−0.83)=P(Z>0.83)=0.2033.
0.7967, 0.2033 and 0.2033
Check → 0.7967+0.2033=1.
X∼N(50,42). Find P(X=54) and P(X<54). Easy
Show solution
X is continuous, so a single value has no area: P(X=54)=0.
z=454−50=1, so P(X<54)=Φ(1)≈0.8413.
P(X=54)=0 and P(X<54)≈0.8413
Check → P(X≤54) is the same number.
A bottle holds X∼N(502,42) ml. Find P(498<X<505) with the table. Medium
Show solution
z1=4498−502=−1 and z2=4505−502=0.75.
P=Φ(0.75)−Φ(−1)=0.7734−Φ(−1), and Φ(−1)=1−0.7734=0.1587 by symmetry.
P=0.7734−0.1587=0.6147.
P(498<X<505)≈0.6147
Check → the calculator line normalcdf(498, 505, 502, 4) gives 0.6147 as well.
X∼N(100,152). The highest 5% of the values lie above a boundary a. Find a to 2 decimals. Medium
Show solution
A right tail of 0.05 means a left area of 0.95: P(X<a)=0.95.
The inverse normal gives z=1.6449.
a=100+1.6449⋅15=124.67.
a≈124.67
Check → invNorm(0.95, 100, 15) gives the same; a lies 1.64 standard deviations above 100.
The marks of a test are X∼N(62,122). Between which two marks do the middle 60% of the pupils lie? Medium
Show solution
The two tails hold 1−0.6=0.4, so 0.2 in each tail.
The lower boundary has left area 0.2: z=−0.8416. The upper one has left area 0.8: z=0.8416.
zσ=0.8416⋅12=10.1, so the boundaries are 62−10.1=51.9 and 62+10.1=72.1.
From 51.9 to 72.1
Check → the interval is symmetric about 62 (62±10.1).
Pupil A scores 83 on a test with N(70,82). Pupil B scores 59 on another test with N(50,62). Who did better compared with their own group? Give both percentile ranks. Medium
Show solution
zA=883−70=813=1.625 and zB=659−50=69=1.5.
The larger z is the better relative position: A.
Percentile ranks: Φ(1.625)⋅100≈94.8% for A and Φ(1.5)⋅100≈93.3% for B.
A did better: z=1.625 against 1.5; ranks 94.8% and 93.3%
Check → both z are positive, so both percentile ranks are above 50%.
X∼N(μ,62) and P(X>50)=0.1. Find the mean μ to 2 decimals. Medium
Show solution
A right tail of 0.1 is a left area of 0.9, so z=1.2816 for the boundary 50.
50=μ+1.2816⋅6, so μ=50−7.69.
μ=42.31.
μ≈42.31
Check → for N(42.31,62) the value 50 lies 1.28 standard deviations above the mean: P(X>50)≈0.1.
X∼B(80,0.3). Use the normal approximation with the continuity correction to estimate P(X≤20). Medium
Show solution
np=24 and nq=56 are both at least 5; npq=16.8, so the standard deviation is 4.099. Use N(24,16.8).
P(X≤20) becomes the area left of 20.5: z=4.09920.5−24≈−0.8539.
Φ(−0.8539)≈0.1966 with the calculator. (With the table and z rounded to −0.85 you get 0.1977.)
P(X≤20)≈0.1966
Check → the exact binomial value is 0.1978; without the correction you would get 0.1646.
X∼N(10,32) and Y∼N(8,42) are independent. Find P(X+Y>25). Medium
Show solution
The mean of X+Y is 10+8=18 and the variance is 9+16=25, so the standard deviation is 5 (not 3+4).
X+Y∼N(18,25), so z=525−18=1.4.
P(X+Y>25)=1−Φ(1.4)≈0.0808.
P(X+Y>25)≈0.0808
Check → the standard deviation 5 is larger than 3 and than 4, but smaller than 3+4=7.
X∼N(μ,σ2) with P(X<30)=0.1 and P(X<50)=0.7. Find μ and σ to 4 significant figures. Hard
Show solution
The inverse normal gives z1=−1.2816 for the left area 0.1 and z2=0.5244 for 0.7.
Two equations: 30=μ−1.2816σ and 50=μ+0.5244σ.
Subtract: 20=1.806σ, so σ=11.07.
Then μ=30+1.2816⋅11.07=44.19.
μ≈44.19 and σ≈11.07
Check → 11.0730−44.19≈−1.28 and 11.0750−44.19≈0.52, the two z-values.
A machine fills bottles with σ=5 ml; the label says 500 ml and at most 2% of the bottles may hold less. How high must the mean be set (2 decimals)? How much more than the present 505 ml? Hard
Show solution
P(X<500)=0.02: the left area 0.02 gives z=−2.0537.
500=μ−2.0537⋅5, so μ=500+10.27=510.27.
At μ=505: P(X<500)=Φ(−1)≈0.1587, about 16% under the label. The mean must go up by 5.27 ml.
μ=510.27 ml; now ≈16% is under the label; 5.27 ml more
Check → Φ(−2.054)≈0.02.
X∼B(200,0.35). Use the normal approximation with the continuity correction for P(60≤X≤75). Is it suitable? Hard
Show solution
np=70 and nq=130, both far above 5: suitable. npq=45.5: use N(70,45.5).
The boundaries are 59.5 and 75.5: z1=−1.5566, z2=0.8154, so P≈Φ(z2)−Φ(z1)≈0.7328.
P(60≤X≤75)≈0.7328; the approximation is suitable
Check → exact 0.7349; without the correction 0.7016.
A shaft has nominal diameter 20 mm and tolerance ±0.03 mm; the diameters are N(20,0.022) (mm). What share is outside? Which σ (3 significant figures) keeps at most 1% outside? Hard
Show solution
The limits are 1.5 standard deviations away: z=0.020.03=1.5. Two tails: 2(1−Φ(1.5))=2⋅0.0668=0.1336, about 13.4%.
For at most 1% each tail is at most 0.005: the limit must lie 2.5758 standard deviations from the mean.
σ≤2.57580.03≈0.01165; take σ=0.0116 mm.
About 13.4% outside; σ≤0.0116 mm
Check → σ=0.0116 gives z≈2.586 and ≈0.0097 outside, below 0.01.
Eight people get into a lift; their weights are independent, each N(75,122) (kg). The limit is 650 kg. Find the probability that the total is over the limit. Hard
Show solution
The total T is normal with mean 8⋅75=600 and variance 8⋅122=1152, so the standard deviation is 1152≈33.94 (not 8⋅12=96).
z=33.94650−600≈1.4731, so P(T>650)=1−Φ(1.4731)≈0.0704.
P(T>650)≈0.0704, about 7%
Check → the wrong standard deviation 96 would give 0.3012, far too big.
Ten times (s): 48,50,51,52,52,53,54,55,57,58. Fit a normal model (use s). How many values lie within xˉ±s? Estimate P(X>60) and say how far you trust it. Hard
Show solution
Sum 530: xˉ=53. Squared distances 86: s2=86/9≈9.56, s≈3.09.
Within xˉ±s (49.91 to 56.09): 7 of 10, 70% (rule: 68%): a good fit.
z=3.0960−53≈2.26, P(X>60)≈0.0118: with only 10 values trust the order of magnitude.
xˉ=53, s≈3.09, 7 of 10 within xˉ±s, P(X>60)≈0.0118 (rough)
Check → the largest value 58 is 1.6 standard deviations above the mean: nothing is far out.
Interactive applications for this topic
Free applications open with a free student account. Teachers can use all applications in a live lesson.