Interactive Lessons

Experimental probability: relative frequency and expected frequency

Lecture notes

Definition

Do an experiment many times

In an experiment you try a chance machine again and again (a coin, a die, a spinner, a bag with replacement) and write down every result. Each try is a trial. The table of how often each result came up is the frequency table.
123456
Example
A die is rolled 30 times:six came up 4 times
02468615243546546
Definition

Frequency and relative frequency

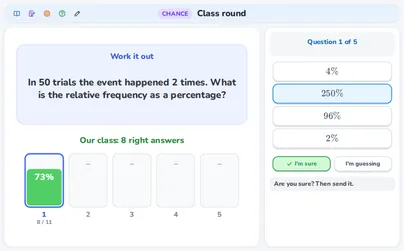
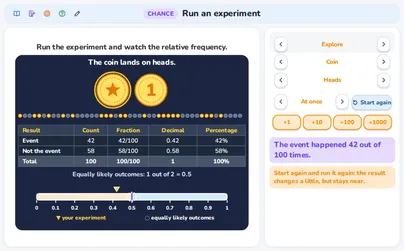
The frequency is how often the event happened in trials. The relative frequency compares it with all the trials: . Write it as a fraction, a decimal or a percentage.
nf
Example
18 out of 40 trials gives
40182245%
Rule

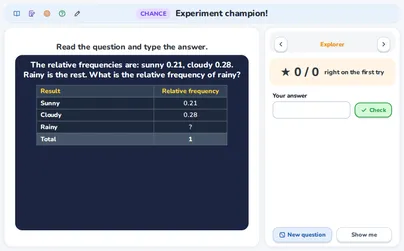
The relative frequencies add up to 1

Every trial has exactly one result, so the counts add up to and the relative frequencies add up to 1 (100%). The last one is 1 minus the others.
1abc
Example
10.400.360.24
Watch out!

Small samples vary

Two runs of the same experiment give different results, most of all with few trials. A short run can be far from the chance. Start again and you get a new run.
Example
A fair coin, 10 tosses:run 1 gave 3 heads, run 2 gave 7
01053172
Rule

The relative frequency settles down

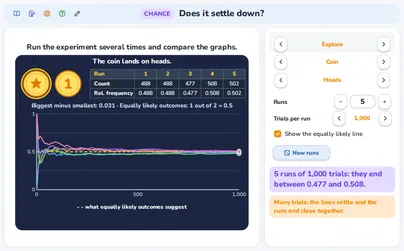
Add more trials and the running relative frequency jumps about less and less. It settles near one number: as grows.
0.518001
Example
A fair coin: after 10 tosses 0.7,after 1000 tosses near 0.5
0.510100001
Rule

More trials give a better estimate

With more trials the runs end closer together, so the estimate of the chance is better. One short run, or the luckiest run, proves little.
10100100000.250.50.7510.5
Example
5 runs of 10 trials end between 0.2 and 0.8;5 runs of 1000 trials between 0.48 and 0.52
10100000.250.50.7510.5
Definition

Estimate a chance from data

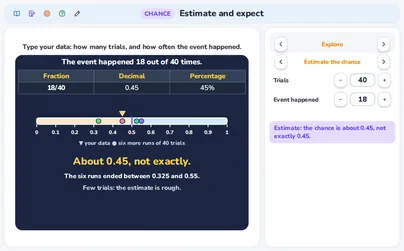
The relative frequency of an experiment is an estimate of the chance: . It is about the chance, not exactly. Another run gives a slightly different estimate.
0121fn
Example
A pin landed point up 18 of 40 times
4018220.45
Tip

When only an experiment can tell

Some things are not equally likely and counting does not help: a drawing pin, a bottle cap, a player taking a penalty. Do the experiment many times and use the relative frequency as the chance.
1822≠1/2
Example
A player scored 18 of 40 penalties:the chance is about 0.45
18/40
Definition

Expected frequency

The expected frequency is how often you expect the event in trials: . The chance can be a fraction, a decimal or a percentage.
NP
Example
A six with a die, 600 rolls
600100
Rule

The other way: how many trials?

To expect an event times, divide by the chance: .
e÷PNe
Example
Expect 25 sixes with a die rolls
25÷1/615025
Rule

Estimate, then predict

Two steps: estimate the chance from the data, then multiply it by the new number of trials. The answer is about, not exactly.
f/n≈P×Ne
Example
A pin: 18 of 40, then 200 drops
18/40≈0.45×20090
Watch out!

Near the expected number, never exactly

The expected frequency is what you expect, not a promise. A real result is usually near it, but rarely exactly it.
8090100110120E
Example
Expected 100 sixes in 600 rolls;real runs gave 94 and 107
8090100110120100
Tip

Compare with equally likely outcomes

When all outcomes are equally likely you can count “k out of n” and compare it with your experiment. They are close? Then the machine looks fair. Calculating this chance comes later.
00.10.20.3Pf
Example
A die: 1 out of 6 is 0.17;the experiment gave 0.15
00.10.20.30.170.15
Rule

Fair or biased?

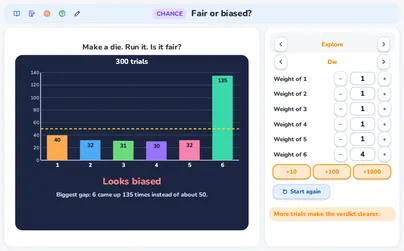
Compare each count with the equally likely count . A count far from it with many trials suggests a biased machine. With few trials you cannot tell yet.
0204060123456n÷k
Example
300 rolls: each.A face with 135 is above: biased
010015012345650
Tip

Real-life tables

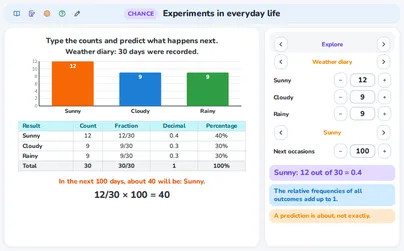
Use real recordings: weather days, goals, traffic lights. Work out the relative frequency of every outcome, check that they add up to 1 and predict the next period.
051015202522A10B8C
Example
40 days, 8 rainy: → about 4 rainy days in 20
8/404/20
Watch out!

A streak changes nothing

A coin has no memory. After many heads in a row the next toss still has the same chance, . Every trial is new.
?
Example
5 heads in a row;next toss: heads 1 out of 2
?1/2
Special case

What comes next

Next come calculating the chance of equally likely outcomes, choosing the approach, and combined events with tree diagrams. Tables, charts and fractions, decimals and percentages have their own groups.
Example
Next: the chance by calculation,then two-step experiments

Exercises

A coin was tossed 50 times and landed on heads 30 times. What is the relative frequency of heads, as a decimal and as a percentage? Easy
503020
Show solution
The event happened times in trials
60%
Answer → 0.6 = 60%
Divide by ALL the trials (50), not by the number of tails.
A fair die is rolled 600 times. About how many sixes do you expect? Easy
1/6
Show solution
The chance of a six is
Expected = chance trials
600100
Answer → about 100
A real run gives a number near 100, not exactly 100.
A drawing pin landed point up 18 times in 40 drops. Estimate the chance of point up, then predict how often in 200 drops. Medium
18/40
Show solution
Step 1, estimate:
Step 2, predict:
18/40≈0.45×20090
Answer → chance about 0.45, about 90 times
Both answers are “about”: another run would give a slightly different estimate.
In 40 days it was sunny on 22 days and cloudy on 10 days. The other days were rainy. What is the relative frequency of rainy days, as a decimal and as a percentage? Medium
402210?
Show solution
Rainy days:
4022108
20%
Answer → 0.2 = 20%
Check: .
A spinner lands on red with a chance of 0.3. How many spins do you need to expect 24 reds? Hard
0.3
Show solution
Backwards:
24÷0.38024
Check:
Answer → 80 spins
Dividing by 0.3 makes the number bigger: you need more spins than reds.
A die is rolled 300 times and shows one face 135 times. How far is that above the equally likely count? What does it suggest? Hard
Show solution
Equally likely count:
The gap is
05010015050E135f85
85 is far above 50 with 300 rolls: the die looks biased
Answer → 85 more; it looks biased
With only 12 rolls the same share would say little: you need many trials to decide.

Interactive applications for this topic

Free applications open with a free student account. Teachers can use all applications in a live lesson.

About the free account and Plus

Are you a teacher?

Start live lessons with these applications for your whole class. Free to try for one month.

Try it free

Fits these school years

IB (MYP, Diploma): MYP 1, MYP 2, MYP 3, MYP 4, MYP 5

Cambridge International: Lower Secondary, stage 7, Lower Secondary, stage 8, Lower Secondary, stage 9

Netherlands: Groep 8, Year 1, Year 2, Year 3 (havo, vwo), Vmbo bb (years 3-4), Vmbo kb (years 3-4), Vmbo gt (years 3-4), Vwo · Mathematics D, Groep 7

Türkiye (MEB): Year 6 (MEB), Year 7 (MEB), Year 8 (MEB)

England (GCSE, A Level): Year 7, Year 8, Year 9

USA (Common Core): Grade 6, Grade 7, Grade 8

What the applications of this topic teach 5 applications

Run an experiment

  • Doing a chance experiment many times and reading the frequency table
  • Writing the relative frequency f/n as fraction, decimal and percentage
  • Expecting about chance × trials, near it but not exactly
  • Simulating a situation with an own chance in per cent

Does it settle down?

  • Seeing the running relative frequency settle near one number
  • Knowing that more trials give a better estimate of the chance
  • Working out the spread of several runs

Estimate and expect

  • Estimating a chance from data with the relative frequency f/n
  • Finding the chance when outcomes are not equally likely
  • Working out the expected frequency: chance × number of trials
  • Estimating the chance, then predicting the count

Fair or biased?

  • Deciding from an experiment whether a coin or die looks fair
  • Comparing each count with the equally likely count
  • Seeing that few trials may make a fair machine look unfair

Experiments in everyday life

  • Recording results of a real-life experiment as counts
  • Working out the relative frequency of every outcome
  • Using the relative frequency as the estimate of a chance
  • Predicting how often an outcome happens next time