Interactive Lessons
Lecture notes Exercises

Data: collect, tally, group and sample

Lecture notes

Definition

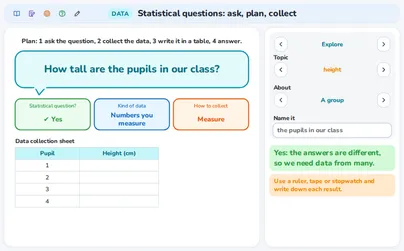
A statistical question

A statistical question expects different answers from different people or things, so you need data from a group. “How tall is Mia?” has one answer; “How tall are the pupils in class 5?” is statistical.
220131
Example
“How many pets do you have?”asked to 25 pupils: statistical
Definition

Variable, group and kind of data

Data answer a question about a variable (what you find out) for a group (who or what you ask). The kind of data is words, counted numbers or measured numbers.
3735383638
Example
Variable: shoe size, group:class 5, kind: counted numbers
3638373840
Rule

Four ways to collect data

Ask everyone (survey), watch and count, measure (ruler, stopwatch) or try it (experiment). Data you collect yourself are primary data; data from a book or a website are secondary data.
???01234564
Example
Counting cars at the gate:watch and count, primary data
12
Definition

The data collection sheet

Make a sheet before you collect, with a row for each possible answer and a column for tally marks. The boxes leave no gaps and do not overlap, so every answer fits in exactly one box.
ABCD
Example
Bus, bike, walk, other:every pupil fits in one row
A3B2C1D17
Definition

Categorical and numerical data

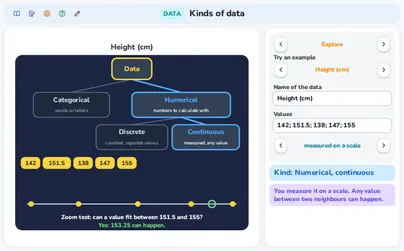
Categorical data are words or labels (colours, pets, sizes S, M, L): you can sort them but not add them. Numerical data are numbers you can calculate with. Categories can have an order.
SML038+538
Example
Eye colour: categorical.Number of pets: numerical
0123
Special case

Numbers used as labels

Shirt numbers, bus lines and house numbers are numbers, but they are only names: adding them means nothing. They are categorical data.
7916+=✘
Example
Bus lines 5 and 7: means nothing
5712+=✘
Rule

Discrete and continuous data

Discrete data are counted in separate steps: nothing fits between 3 pets and 4 pets. Continuous data are measured and any value can happen, so a measured value is rounded: 152 cm stands for .
34151152153152
Example
Goals scored: discrete.Height 152 cm: continuous
012345151152153152
Rule

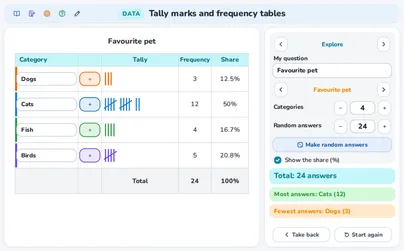
Tally marks in fives

Make four strokes and cross them with the fifth: one bundle is 5. Count the bundles first, then add the single strokes. 3 bundles and 2 strokes make .
17
Example
4 bundles and 3 strokes:
23
Rule

The frequency table and its total

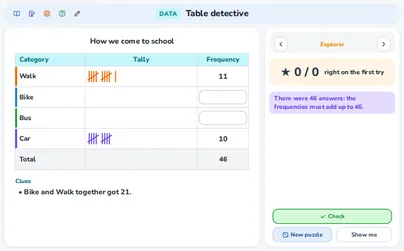
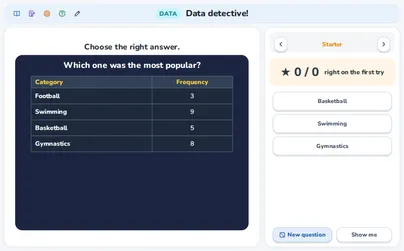
A frequency table shows the category, the tally and the frequency (how many). The frequencies add up to the total, the number of answers. If they do not, a count is wrong.
A5B3C6D216
Example
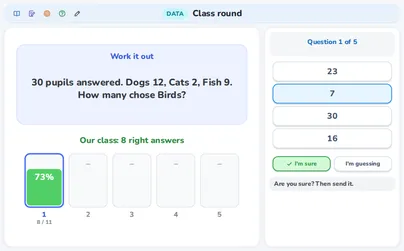
Dogs 8, Cats 6, Fish 4, Birds 7: answers
A8B6C4D725
Rule

Reading a table

Most is the biggest frequency, fewest the smallest. How many more: subtract. How many altogether: add. A missing frequency is the total minus the other frequencies.
A5B9C3
Example
Dogs 8, Cats 6: more.Total 25, others 18: missing
A8B62A8B6C4D?25
Rule

The share in %

The share of a category is its frequency ÷ the total × 100: (f the frequency, n the total). All the shares add up to 100%.
32%24%16%28%100%
Example
14 of 40 pupils chose pizza:%
Rule

Grouping data into classes

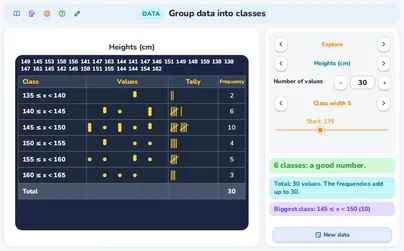
Many different numbers go into classes of equal width. Write for measured data and 10–19 for counted data. A value on a border goes in the upper class: 20 is in . Aim for 5 to 8 classes.
1020304050
Example
Values 12 to 47, width 10 from 10: classes
1020304050
Definition

Population and sample

The population is everybody we want to know about. A sample is the part of the population that we ask, because asking everyone takes too long.
Example
School of 600 pupils: population.40 pupils asked: sample
60040
Watch out!

Fair and biased samples

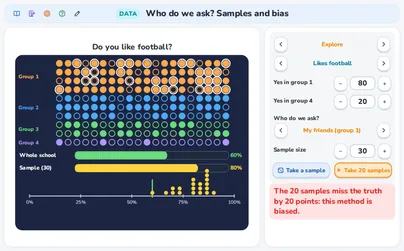
A sample is fair when everyone has the same chance to be picked (random). It is biased if it asks only friends, the first at the gate, volunteers or the wrong group. A leading question also pushes the answer.
✘✔
Example
Only the football club: biased.40 of 600 drawn by computer: fair
✘✔
Watch out!

Response rate and who answers

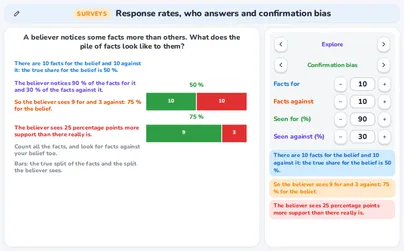
The response rate is the share of the surveys that come back: returned ÷ sent × 100. A low rate can bias a result even when many people were asked, because the people who answer may think differently from the people who do not. If two groups answer at different rates, the answers show the wrong split. The application "Response rates, who answers and confirmation bias" has Response rate, Who answers and Confirmation bias, where you also see that people notice what fits what they already believe.
Example
A school sends 400 surveys and 120 come back: 120 ÷ 400 = 0.3, a response rate of 30 %. Of 1 000 people 600 like a new rule (60 %). If 80 % of them answer and 30 % of the others, 480 + 120 = 600 answers come back and 480 ÷ 600 = 0.8, so 80 % say "like it": 20 percentage points too many.
Rule

The fair mix

Ask every group in proportion to its size: a group with 40% of the pupils gives 40% of the sample, so every group is heard.
40%25%20%15%40%25%20%15%
Example
Groups of 80, 60, 40, 20 pupils, sample of 20:, then 6, 4, 2
80604020200864220
Rule

Estimating from a sample

Find the share in the sample, then take that share of the population: an estimate, not an exact answer.
3710×50?500
Example
9 of 25 like football (36%): pupils
91625×24216384600
Tip

Samples differ

Two random samples give different results, but they gather around the truth. A bigger random sample is more reliable. A biased method misses the truth in the same direction every time.
204060n=5204060n=60
Example
Samples of 5 jump about;samples of 60 stay close
204060n=5204060n=60
Definition

Two-way table

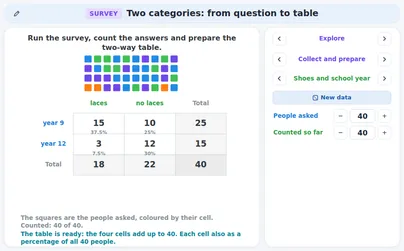
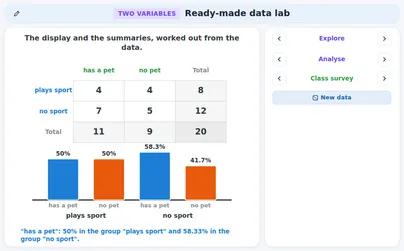
A two-way table sorts the same group by two categories at once: one category in the rows, the other in the columns, with the totals at the end of every row and column. A cell tells “both”, a total tells “one” (MEB 10.2.1 a, b, c, ç).
Example
30 pupils: girls 8 cycle and 7 walk, boys 9 cycle and 6 walk cycle, in all
Rule

Investigating one variable

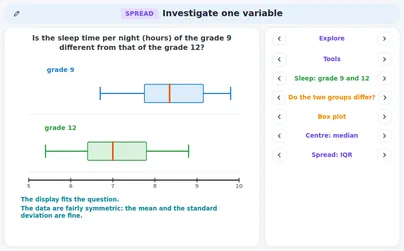
Start with a question, choose a display, then a centre and a spread, and write one careful sentence with “in this sample”. To compare two groups use the same scale. With a skewed shape or a far value, tell the median and the IQR (MEB 9.6.1 d–g).
Example
Sleep in hours: group A has median 8 and IQR 1, group B has median 7 and IQR 2A sleeps hour more in this sample and is steadier
Definition

The five kinds of question

The variables decide the kind of question. (1) One categorical variable: how are the answers spread? (2) One quantitative variable: what is typical and how spread out is it? (3) Two quantitative variables: is there a relationship? (4) One quantitative and one categorical variable: compare the groups. (5) Two categorical variables: is there a relationship in a two-way table? (MEB 12.5.1 b).
Example
A table of 20 used cars has the age, the price, the fuel and the colour. “How old are the cars?” is kind 2. “Is the price related to the age?” is kind 3. “Is the price different for diesel and petrol cars?” is kind 4. “Is the colour related to the fuel?” is kind 5.
Rule

Which display and which summary fit

Categorical: a bar chart with counts or percentages. One quantitative variable: a dot plot, histogram or box plot with the median and IQR (mean and SD only for a symmetric shape). Two quantitative: a scatter plot with r. Quantitative by group: a box plot per group. Two categorical: a two-way table with the percentages of each row (MEB 12.5.1 d).
0510ABC68101214xy
Example
Prices of five cars (in 1000 €): 8, 9, 10, 11 and 60. The median is 10, the mean is . One far price pulls the mean up, so the median is the safer summary here.
0102030405060
Rule

Reading a conclusion: supported or not supported

A statement is supported when the numbers of the sample show it. It is not supported when it claims a cause, claims something for everybody, or says more than the numbers say. Write “in this sample”: a new sample would give other numbers (MEB 12.5.1 f, g).
Example
In a sample of 20 cars the median price is 14 (thousand euro) for diesel and 11 for petrol. “In this sample diesel cars have a higher median price”: supported. “Diesel makes a car dearer”: not supported (a cause). “All diesel cars in the country cost more”: not supported (one sample).
Tip

Question ready-made data

Before you use ready-made data ask: who collected them and how? How are the variables defined? Does the sample fit the group you want to say something about? If the data do not hold the variable you wanted, adapt your question to the variables they do hold (MEB 12.5.1).
Example
A table of 20 cars from one dealer is not “all cars in the country”. It has the age but not the mileage you wanted: ask about the age instead, or find other data.
Tip

What comes next

Charts and graphs draw your table, averages and range summarise it, spread compares data sets, and two-way tables sort two things at once.
Example
Your frequency tablebecomes a bar chart next
A8B6C4D702468ABCD

Exercises

A tally shows 3 bundles of five and 2 single strokes. How many answers is that? Easy
Show solution
Each bundle of five counts 5
3 bundles:
Add the single strokes:
17
Answer → 17 answers
Count the bundles first, not the strokes one by one.
25 pupils chose a pet: Dogs 8, Cats 6, Fish 4. How many chose Birds, and which pet is the most popular? Easy
A8B6C4D?25
Show solution
The frequencies add up to the total 25
The known ones:
Birds:
A8B6C4D725
The biggest frequency is Dogs with 8
A8B6C4D725
Answer → 7 chose Birds; Dogs are the most popular
The total minus the known frequencies gives the missing one: .
14 of the 40 pupils who voted chose pizza. What percentage chose pizza? Medium
Show solution
Share = frequency ÷ total × 100
Answer → 35%
Divide by the total, not by the biggest frequency: .
Heights run from 12 cm to 47 cm. Classes of width 10 start at 10. Which class holds 30, and how many classes are needed? Medium
1020304050
Show solution
The classes are , , ,
1020304050
A border value goes in the upper class: 30 is in
The biggest value 47 is in the last class: 4 classes
Answer → 30 is in 30 ≤ x < 40; 4 classes
The border value starts the next class.
In a random sample of 25 pupils, 9 like football. The school has 600 pupils. Estimate how many pupils like football. Hard
91625?600
Show solution
Share in the sample: %
36%64%25
Take that share of the school: % of
91625×24216384600
Answer → about 216 pupils
It is an estimate: another random sample gives a slightly different number.
A school has 450 pupils. Mia asks 30 pupils of the football club about their favourite sport. Why is this sample biased, and how can she get a fair one? Hard
Show solution
Only one small group can be asked: not every pupil has a chance
Fair: give all 450 pupils a number and draw 30 numbers
✔
Or ask every th pupil on a list
Answer → biased: only one small group; fair: 30 numbers drawn from 450
Every pupil needs the same chance.
Are you a teacher?

Start live lessons with these applications for your whole class. Free to try for one month.

Try it free

Fits these school years

IB (MYP, Diploma): PYP, MYP 1, MYP 2, MYP 3, MYP 4, MYP 5, Diploma, year 1, Diploma, year 2

Cambridge International: Primary, stage 4, Primary, stage 5, Primary, stage 6, Lower Secondary, stage 7, Lower Secondary, stage 8, Lower Secondary, stage 9, IGCSE

Netherlands: Groep 6, Groep 7, Groep 8, Year 2, Year 3 (havo, vwo), Havo · Mathematics A, Vwo · Mathematics A, Vwo · Mathematics C, Groep 5, Vmbo bb (years 3-4), Vmbo kb (years 3-4), Vmbo gt (years 3-4)

Türkiye (MEB): Year 5 (MEB), Year 6 (MEB), Year 7 (MEB), Year 8 (MEB), Year 9 (MEB), Year 10 (MEB), Year 12 (MEB)

England (GCSE, A Level): Year 4, Year 5, Year 6, Year 7, Year 8, Year 9, Year 10 (GCSE), Year 11 (GCSE), Year 12 (A Level), Year 13 (A Level)

USA (Common Core): Grade 5, Grade 6, Grade 3, Grade 4, Grade 7, Grade 8, Algebra 1, Algebra 2

What the applications of this topic teach 11 applications

Statistical questions: ask, plan, collect

  • Telling a statistical question from a question about one person
  • Saying which data answer a question: variable, group, kind
  • Choosing how to collect data: survey, counting, measuring, experiment
  • Setting up an empty data collection sheet

Tally marks and frequency tables

  • Making tally marks in fives and counting a tally
  • Sorting answers into a frequency table
  • Reading a table: most, fewest, altogether, how many more
  • Writing the share of a category as a percentage

Kinds of data: categorical, discrete, continuous

  • Telling categorical data from numerical data
  • Knowing that numbers used as names are categorical
  • Telling discrete data from continuous data and rounding measured values

Group data into classes

  • Grouping numerical data into classes of equal width
  • Writing classes as 10 ≤ x < 20 or 10–19
  • Choosing a class width and start for about 5 to 8 classes
  • Knowing classes leave no gaps and do not overlap

Who do we ask? Samples and bias

  • Telling a population from a sample
  • Telling a fair sample from a biased one
  • Estimating a count for the population from a random sample
  • Spotting a leading question and writing a neutral one

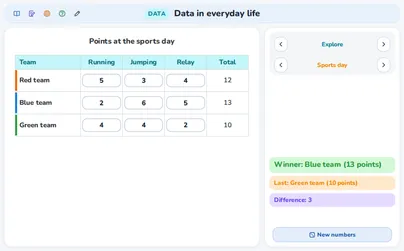
Data in everyday life

  • Seeing ways to collect data in everyday scenes
  • Telling primary from secondary data
  • Reading a table with rows and columns, with totals and differences
  • Working out the share of a category in a poll

Table detective

  • Using the total to find a missing frequency
  • Using clues to find missing numbers in a table

Response rates, who answers and confirmation bias

  • Working out a response rate and what a low rate may do
  • Seeing how groups answering at different rates bias the result
  • Explaining confirmation bias

Two categories: from question to table

  • Turning a situation into a question about two categorical variables
  • Planning a survey: who is asked, how many, random or not
  • Counting survey answers into a two-way table

Investigate one variable

  • Choosing the kind of question and the fitting display and summary
  • Analysing two groups by display, centre and spread
  • Judging whether the data support a statement: in this sample

Ready-made data lab

  • Picking a ready-made data set and two variables
  • Choosing a display and a summary that fit the kind of question
  • Judging statements as supported or not supported