Two variables: scatter plots, correlation and regression
Lecture notes
Definition
Pairs and the table of pairs
In a study of two variables every person (or thing) gives two numbers, a pair (x,y). The table of pairs lists them: one column or row for x and one for y. Both variables are quantitative: they are numbers, such as hours and a pulse.
Example
Six pupils: hours of sport per week (x) and resting pulse (y). The third pupil does 3 hours and has a pulse of 75, so the pair is (3,75). Six pairs give six dots.
Definition
The scatter plot
A scatter plot draws every pair as one dot: x along the horizontal axis and y along the vertical axis. Look at the whole cloud of dots. Does it rise or fall (direction)? Is it a narrow band or wide (strength)? Does it bend? Is one dot far from the others?
Example
Twelve pupils: the dots fall from left to right (dashed arrow). The pupils who do more sport tend to have a lower resting pulse. The arrow is only a help for the eye.
Definition
The question, the explanatory and the response variable
A good question names two quantitative variables and who is measured: “Is there a relationship between x and y among the pupils of a school?” The explanatory variablex goes on the horizontal axis. The response variabley is the one we expect to change with it. Swapping them does not change r, but it changes the line of best fit.
Example
Five pairs give the line y=1+2x. With the axes swapped the line is x=0.2+0.4y: another line, but the same r=0.89.
Rule
Plan and prepare the data
To get pairs you can trust: choose the pupils at random (everybody has the same chance), take enough pairs (15 or more), keep no names, and prepare the lists. Both lists have the same length, every value is a number and the units are clear (hours, beats per minute).
Example
A school has 600 pupils. Give each pupil a number, let the computer draw 30 numbers and measure those 30 pupils: 30 pairs. Asking 5 friends is not random and too few.
Rule
The count ratio by regions
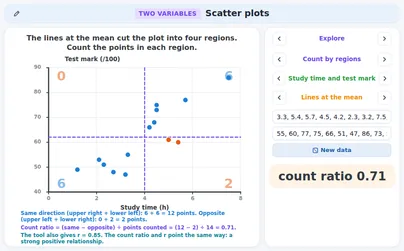
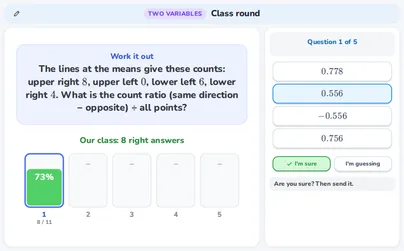
Draw a vertical line at the mean of x and a horizontal line at the mean of y. They cut the plot into four regions: A upper right, B upper left, C lower left, D lower right. Count the dots in each region (a dot on a line is not counted). A and C are the same direction regions, B and D the opposite ones. The count ratio goes from −1 to 1.count ratio=A+B+C+D(A+C)−(B+D)
Example
Ten dots: A =4, B =1, C =4, D =1. The count ratio is 10(4+4)−(1+1)=106=0.6.
Rule
Reading the count ratio
A count ratio near 1 means that almost all dots are in A and C: a positive relationship (higher x, higher y). Near −1 almost all dots are in B and D: a negative relationship. Near 0 both pairs of regions hold the same number: no clear direction. This is the idea behind the correlation coefficient r.
The correlation coefficientr is one number for the straight-line relationship of two quantitative variables. Software gives it: you do not work it out by hand. Its sign is the direction and its size is the strength. r=1 or r=−1 means that all dots lie on a straight line. r has no unit.−1≤r≤1
Example
For the five pairs (1,45), (2,46), (3,52), (4,58), (5,59) the software gives r=0.97: a strong positive relationship.
Rule
Direction and strength in words
The direction is positive when r>0 (the dots rise) and negative when r<0 (they fall). The strength comes from ∣r∣, the size without the sign. A rule of thumb (books differ a little): below 0.2 no relationship, from 0.2 to 0.4 weak, from 0.4 to 0.7 moderate, 0.7 or more strong.
Example
r=−0.55: the sign is minus, so the relationship is negative. ∣r∣=0.55 lies between 0.4 and 0.7: moderate. A moderate negative relationship.
Special case
r = 1, r = −1 and no variation
If all dots lie on one rising line, r=1; on a falling line, r=−1. In real data this almost never happens. If all the y values are equal (or all the x values) nothing varies: r cannot be worked out and the software shows an error or a dash. Then there is no direction to talk about.
Example
Six pupils all have a resting pulse of 70, whatever their sport: the dots lie on a flat line. r does not exist, but the picture is clear: the pulse does not change with sport.
Tip
Always draw the plot first
Very different data sets can have the same r. Only the picture shows the difference: a straight band, a curve, one far dot, or all dots at one x value. Never report r without looking at the scatter plot.
Example
Anscombe’s four data sets of 11 pairs each all have r=0.82 and the same line y=3+0.5x. Only the first one looks like a straight band.
Definition
An outlier: one far dot
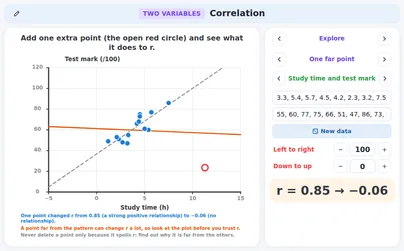
An outlier is a dot far from the others. One outlier can change r a lot: it can make a relationship appear or hide one. Find out why it is far away (a mistake, or a different kind of person?). Do not delete it just because it spoils r, and give r with and without it.
Example
Ten pupils (shoe size and reading score) have r=−0.02. Add their teacher with shoe size 46 and score 49 and r=0.63. One dot made the relationship.
Watch out!
A relationship is not a cause
Two variables can move together without one causing the other. A third variable can explain both, or the cause can run the other way. Only a well-designed experiment can show a cause. Say “goes with” or “tends to”, not “causes”. Atomic weight and density of elements also go together, yet neither makes the other.
Example
Over 12 months the ice creams sold and the swimming accidents have r=0.86. Hot weather (orange months) raises both. Inside the cold months r=−0.27 and inside the warm months r=0.32.
Rule
One sample is one sample
Another random sample gives other pairs, so another r. The r of a sample is only an estimate for the whole group. Write “in this sample” and do not give r too many digits. More pairs make r steadier.
Example
In a (simulated) school where r is about 0.6, two random samples of 12 pupils gave r=0.85 and r=0.34.
Watch out!
Few pairs, not a random sample
Five friends are too few and not a random sample: they cannot speak for everybody. A line through a few chosen dots can look perfect and still be wrong for the whole group.
Example
The five orange friends have r=0.98 and a steep line. All 12 pupils (the grey ones too) have r=0.34 and a flatter line.
Definition
The line of best fit
The line of best fit (regression line) runs through the cloud and is used to predict y from x. The slopeb tells how much y changes for 1 more x. The intercepta is the predicted y at x=0 (it can be meaningless). Software gives a and b.y^=a+bx
Example
Revision hours x and marks y of five pupils give y^=40+4x. Each extra hour goes with about 4 more marks in this sample.
Definition
The residual
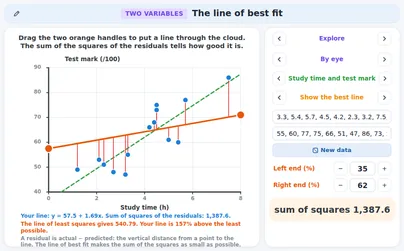
The residual of a dot is actual minus predicted: the vertical distance from the dot to the line. A dot above the line has a positive residual, a dot below it a negative one.e=y−y^
Example
At x=4 the line predicts 40+4⋅4=56 and the pupil scored 58: residual 58−56=+2. At x=2 it predicts 48 and the pupil scored 46: residual 46−48=−2.
Rule
Least squares
The best line is the one with the smallest sum of the squares of the residuals: the method of least squares. Squaring makes every miss positive and punishes big misses more. Every other line has a larger sum.∑e2=e12+e22+…
Example
Best line y^=40+4x: 1+4+0+4+1=10. A line drawn by eye, y^=44+3x: 4+16+1+4+0=25. The best line has the smaller sum.
Rule
Two things that are always true
For the line of least squares the residuals add up to 0, and the line goes through the point of the means(xˉ,yˉ). So you can find the intercept from the means and the slope.a=yˉ−bxˉ
Example
xˉ=3, yˉ=52 and b=4: a=52−4⋅3=40. The residuals add up to 1−2+0+2−1=0.
Rule
Interpolation: predicting inside the data
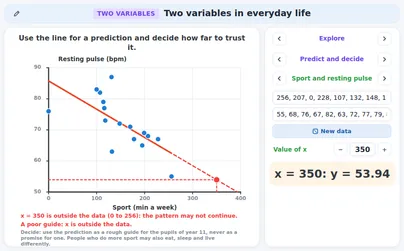
Predicting for an xinside the range of the data is interpolation. It is fairly safe when the relationship is strong and the dots are close to the line. A prediction is a guide, not a promise.
Example
x=2.5 hours lies between 1 and 5, inside the data. y^=40+4⋅2.5=50 marks.
Watch out!
Extrapolation and impossible values
Predicting outside the range of the data is extrapolation. The pattern may stop or bend, and the line can give values that are impossible: a mark above 100, a negative length. Do not stretch a line far beyond the data.
Example
x=20 hours: y^=40+4⋅20=120 marks. That is impossible: the line reaches 100 at 15 hours (40+4⋅15=100).
Watch out!
Mixed groups can turn a trend round
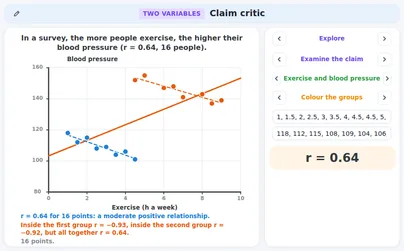
When two groups are mixed in one plot, the trend of all dots together can be the opposite of the trend inside each group. Colour the groups and look at each one.
Example
Hours of study and marks of 10 pupils in two courses: all together r=−0.64 (more study, lower mark?). Inside the easy course r=0.93 and inside the hard course r=0.98: more study raises the mark in both. The hard-course pupils study more but get lower marks.
Special case
r measures straight lines only
r tells how well the dots follow a straight line. Dots on a curve can have a strong relationship and still r=0. So r=0 means “no straight-line relationship”, not “no relationship”.
Example
Seven dots on y=x2 with x from −3 to 3: r=0 and the best line is flat at y=4. Yet y is exactly x2.
Rule
When the dots bend, use another model
Even a high r does not make a straight line right. If the dots bend, look at the residuals: a pattern such as +,+,−,−,−,+ says “curve”. Then try a power or an exponential model (the applications power-fit and exponential-models).
Example
Bacteria that double: 1, 2, 4, 8, 16, 32 at times 0 to 5. The best straight line has r=0.91, but the dots follow y=2x exactly.
Tip
A careful sentence
Say what the data show and nothing more: “In this sample of [number] [group], [x] and [y] have a [strength] [positive or negative] relationship (r= …). This does not show that [x] causes [y].” Words like “tends to” are right; “proves” and “always” are wrong.
Example
In this sample of 30 pupils, more sleep goes with higher marks: a moderate positive relationship (r=0.55). This does not show that sleep causes the marks.
Tip
The checklist for claims
When somebody makes a claim about two variables, check: (1) a third variable behind both? (2) a far dot that makes or hides the pattern? (3) mixed groups? (4) few pairs or not a random sample? (5) extrapolation or an impossible value? (6) words too strong for the size of r or a cause? (7) a curve, where r does not fit?
Example
Claim: “Ice cream sales and swimming accidents have r=0.86, so ice cream is dangerous.” Check 1: hot weather raises both. Check 6: the claim says “cause”. Verdict: refute.
Rule
Refute or accept
Name the flaw and give a number as the reason: r with and without a dot, r inside each group, the value of the line at the x of the claim. Refute a claim when the flaw changes its conclusion. Accept it when it says only what the data show, with care.
Example
“Pupils with bigger shoes read better (r=0.63).” Without the teacher r=−0.02: refute. “In this random sample of 30 pupils, more sleep goes with higher marks (r=0.55)”: no cause, inside the data: accept.
Tip
Where to look next
When the dots bend open the applications power-fit and exponential-models. For the summary tools of one variable open data-tools. To practise choosing a display and a summary for ready-made data open ready-data-lab in “Data and questions”.
Example
If y doubles at every step (1, 2, 4, 8, 16, 32) open exponential-models. If y grows like x2 open power-fit.
Exercises
The software gives r=−0.96 for 12 pupils: hours of sport per week and resting pulse. Say the direction and the strength of the relationship. Easy
Show solution
r is negative, so the dots fall from left to right: a negative relationship.
∣r∣=0.96 is 0.7 or more: strong.
Answer → a strong negative relationship
This describes the dots in the sample. It does not say that sport lowers the pulse.
The dashed lines go through the means of x and y. Count the dots in the four regions and work out the count ratio. Easy
Show solution
Count: A =4, B =1, C =4, D =1.
Same direction: 4+4=8. Opposite: 1+1=2.
The count ratio is 108−2=0.6.
Answer → 0.6
A positive count ratio points the same way as r. The software gives r=0.78 for these dots: also positive.
For five pupils the mean revision time is 3 hours and the mean mark is 52. The slope of the line of best fit is 4 marks per hour. Find the intercept a and write the line. Easy
Show solution
The line goes through the point of the means: 52=a+4⋅3.
a=52−12=40.
Answer → y^=40+4x
Check: at x=3 the line gives 40+12=52, the mean mark.
The line of best fit is y^=40+4x. A pupil with x=4 scored 58. Find the residual and say whether the dot is above or below the line. Easy
Show solution
Predicted: 40+4⋅4=56.
Residual: actual minus predicted: 58−56=2.
The residual is positive: the dot is above the line.
Answer → residual +2, above the line
Check: in the picture the orange dot is 2 marks above the line.
Use y^=40+4x (the revision hours were between 1 and 5) to predict the mark after 2.5 hours. Can you trust it? Medium
Show solution
y^=40+4⋅2.5=50.
2.5 lies between 1 and 5, inside the data, and r=0.97 is strong.
Answer → 50 marks, a good guide (interpolation)
It is still a guide: another pupil can score a few marks more or less.
Four residuals of the line of best fit are 1, −2, 0 and 2. Find the fifth residual and the sum of the squares of the five. Medium
Show solution
The residuals of the line of best fit add up to 0: 1−2+0+2+e=0.
So e=−1.
Squares: 1+4+0+4+1=10.
Answer → −1 and the sum of squares 10
These are the residuals of the five pupils of this page: y^=40+4x.
Use y^=40+4x to predict the mark after 20 hours of revision. Is that possible? From how many hours does the line give more than 100? Medium
Show solution
y^=40+4⋅20=120.
A mark above 100 is impossible.
40+4x=100 gives x=15: above 15 hours the line gives more than 100.
Answer → 120 marks: impossible; the line passes 100 at 15 hours
The data only cover 1 to 5 hours: this is extrapolation.
For 11 dots (10 pupils and their teacher) the software gives r=0.63. Without the teacher’s dot r=−0.02. What does the teacher’s dot do, and what do you say about the pupils? Medium
Show solution
With the dot r=0.63 (moderate positive), without it r=−0.02 (no relationship).
One far dot creates the relationship.
Among the 10 pupils there is no relationship between shoe size and reading score.
Answer → the far dot creates the relationship; among the pupils there is none
The teacher is not a pupil, so leaving the dot out is fair here. Always say that you left it out.
Two lines go through the five dots: y^=40+4x and y^=44+3x. Which is the better line? Give the sum of the squares of the residuals of each. Medium
Show solution
First line: residuals 1,−2,0,2,−1; squares 1+4+0+4+1=10.
Second line: predicted 47,50,53,56,59, residuals −2,−4,−1,2,0; squares 4+16+1+4+0=25.
The smaller sum belongs to the better line.
Answer → y^=40+4x (10 against 25)
The residuals of the second line add up to −5, not 0: it is not the line of least squares.
Over 12 months the ice creams sold and the swimming accidents have r=0.86. Somebody says: “ice cream causes swimming accidents”. Why is that not supported? Medium
Show solution
Look at the colours: warm months (orange) have many ice creams and many accidents, cold months (blue) have few of both.
Hot weather is a third variable that raises both.
Inside the cold months r=−0.27, inside the warm months r=0.32: hardly any relationship is left.
Answer → a third variable (hot weather) explains both; a pattern is not a cause
Only a well-designed experiment can show a cause.
Two random samples of 12 pupils of the same school give r=0.85 and r=0.34. Can both be right? What should a report say? Medium
Show solution
Each sample has other pupils, so each has another r.
Both are honest estimates of the r of the whole school.
A report says “in this sample” and warns that a new sample gives another r.
Answer → yes, both can be right; say “in this sample” and mention the uncertainty
More pairs make r steadier.
Five pairs: (1,4), (2,3), (3,7), (4,11), (5,10). Find the line of best fit and the sum of the squares of the residuals. Hard
Show solution
Means: xˉ=3, yˉ=7. Deviations: x−xˉ is −2,−1,0,1,2 and y−yˉ is −3,−4,0,4,3.
∑(x−xˉ)2=10 and ∑(x−xˉ)(y−yˉ)=6+4+0+4+6=20, so b=1020=2 and a=7−2⋅3=1: y^=1+2x.
The line for five pupils is y^=40+4x (x in hours) with r=0.97. Now x is in half-hours: x′=2x. Find the new slope, intercept and r. What changes if you swap x and y? Hard
Show solution
x=2x′, so y^=40+2x′: slope 2, intercept 40. r has no unit: still 0.97.
Swapped: r stays 0.97, but the slope of x on y is about 0.24, not 41: another line.
Answer → slope 2, intercept 40, r=0.97; swapped: same r, other line
A new unit changes the slope, not r.
Ten pupils, two courses. All together r=−0.64, in the easy course r=0.93, in the hard course r=0.98. “Studying more lowers your mark,” says a teacher. Refute it. Hard
Show solution
Group lines: easy y^=75.6+3.4x, hard y^=18.9+3.9x. Both slopes are positive.
At 5 hours: easy 92.6, hard 38.4.
The negative r comes from mixing the groups.
Answer → refute: inside each course more study raises the mark
Colour the groups before you trust one r.
Five dots lie exactly on y=x2: (−2,4), (−1,1), (0,0), (1,1), (2,4). The software gives r=0. A pupil says: “So x and y are not related.” Is that right? Hard
Show solution
xˉ=0 and the dots on the left mirror the dots on the right: the line of best fit is flat, y=yˉ=2, so r=0.
But y=x2 exactly: a perfect relationship, a curve.
r only measures straight lines: draw the plot first.
Answer → no: there is no straight-line relationship, but y is exactly x2
Check: x=2 and x=−2 both give y=4.
Interactive applications for this topic
Free applications open with a free student account. Teachers can use all applications in a live lesson.