Interactive Lessons

Graphs of real situations

Lecture notes

Definition

Distance–time graph

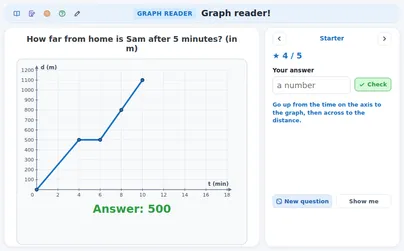
Time goes along the bottom, the distance from the start (or from home) goes up. Every point says: at this moment the walker is this far away.
tdtd
Example
Sam is 150 m from home after 3 minutes:
124100200td3150
Rule

Steepness is speed

The steeper the piece, the faster the walker. Speed = distance of the piece ÷ time of the piece.
tdAB
Example
From 100 m to 400 m in 3 minutes:
1234100200300400td300
Rule

Flat is standing still, down is walking back

A flat piece: the distance does not change, so the walker stands still. A piece that goes down: the distance from home gets smaller, the walker walks back (a negative speed).
td
Example
Flat at 350 m from minute 5 to 9, then down to 150 m at minute 13:
td1315059350
Rule

Average speed

Average speed = all the metres ÷ all the time, the time standing still included.
td
Example
Walks 200 m in 2 min, rests 3 min, walks 300 m in 5 min:
246812100200300400td10500
Rule

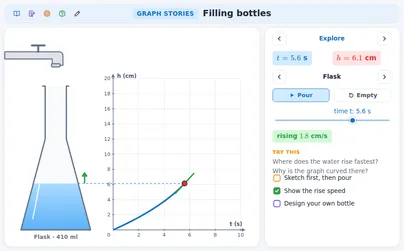
Filling a bottle

Water flows in at a steady rate. Where the bottle is narrow the surface rises fast (a steep graph); where it is wide the surface rises slowly (a flat graph).
th
Example
A tap gives 60 ml each second. A narrow part of 10 cm², a wide part of 30 cm²:
th1612
Definition

Speed–time graph

Now the vertical axis is the SPEED, not the distance. A flat piece is a steady speed; the car only stands still when the graph lies on the axis (speed 0).
tv
Example
Flat at 8 m/s from 2 s to 6 s:
484tv682
Rule

Acceleration

The steepness of a speed–time piece is the acceleration: the change of the speed ÷ the time. Slowing down gives a negative number.
tvtΔv
Example
From 10 m/s to 4 m/s in 3 s:
12344812tv3−6
Rule

Area is distance

The area under a speed–time graph is the distance travelled. Cut it into rectangles (speed × time) and triangles (½ × time × speed).
tvv×t½vt
Example
6 m/s for 5 s, then from 6 m/s down to 0 in 4 s:
51036tv3012
Rule

A sloping piece is a trapezium

A piece from speed a to speed b is a trapezium: the mean of the two speeds times the time.
tvabmt
Example
From 4 m/s to 10 m/s in 5 s:
tv41075
Definition

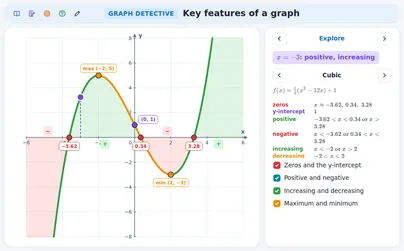
Key features of a graph

Zeros (where the graph meets the x-axis), positive and negative parts, increasing and decreasing parts, the highest and the lowest point (maximum, minimum). Say each one with its interval.
xy
Example
Lowest −2 °C at 4:00, then increasing to 10 °C at 15:00:
8245xy4−21510
Rule

Average rate of change

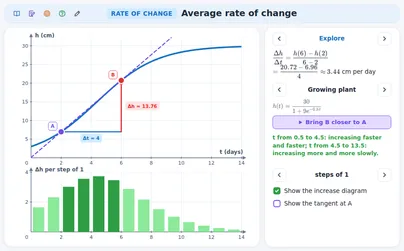
From a to b: the change of the value ÷ the change of the time. It is the steepness of the line (secant) through the two points.
xyΔxΔy
Example
A plant is 10 cm on day 2 and 22 cm on day 6:
2468102030xy412
Rule

Faster and faster, or more and more slowly

Look at the increases per step: growing increases mean it grows faster and faster, shrinking increases mean more and more slowly, equal increases mean a steady rate.
xyxy
Example
Heights 3, 5, 9, 16 cm: the increases are 2, 4, 7.
1234551015xy247
Tip

Read corners, give units

Read the corner points of the graph and work piece by piece. A rate has the unit of y per unit of x (m per min, cm per day).
xy
Example
A price goes up 18 euros in 3 years:
123461218xy18
Special case

A jump in the graph

A vertical piece: the value changes at once, no time goes by. Someone who gets into a bath makes the water level jump up.
th
Example
The bath is 30 cm deep; Sara gets in and it jumps up 6 cm:
2468243036th6
Watch out!

The graph is not a picture

A distance–time graph does not show the road. Riding up and down a hill, the distance from the start still only grows; a rest is a flat piece.
td✔
Example
Mila rides over a hill and rests at the top:
td✘td✔
Watch out!

Mean of the speeds

Do not average the speeds when the times differ. Add the distances and the times first.
td✔
Example
60 m/min for 1 min, then 30 m/min for 2 min:
123450100150td4045✘

Exercises

Mila rides 600 m in 5 minutes, rests 3 minutes, then rides 600 m in 4 minutes. What is her speed in each piece she rides? Easy
5104008001200td
Show solution
First piece: m/min.
The rest is a flat piece: speed 0.
Last piece: m/min.
td1200150
Answer → 120 m/min and 150 m/min
Check: the last piece is steeper than the first one: .
A car speeds up from 0 to 12 m/s in 4 s. Find the acceleration and the distance in those 4 s. Easy
Show solution
Acceleration: m/s².
123454812tv12
The piece is a triangle: m.
123454812tv24
Answer → 3 m/s² and 24 m
Check: the mean speed is 6 m/s, and m.
Sam walks 300 m in 3 min, stands still 2 min, then walks 200 m in 5 min. What is his average speed for the whole walk? Medium
4812200400600td
Show solution
Total distance: m.
Total time, the rest included: min.
Average speed: m/min.
td10500
Answer → 50 m/min
Check: the mean of the speeds 100 and 40 would give 70: wrong, the times differ.
A car goes from 4 m/s to 10 m/s in 6 s, drives 6 s at 10 m/s, then slows down to 0 in 5 s. Find the total distance and the acceleration while slowing down. Medium
612184812tv
Show solution
Trapezium: m.
Rectangle: m.
Triangle: m. Total: m.
tv426025
Slowing down: m/s².
Answer → 127 m and −2 m/s²
Check: the speed never goes below 0, so the car only moves forward.
A plant has height cm after t days. Find the average growth per day from day 1 to day 4 and from day 4 to day 6. How does it grow? Hard
Show solution
, , .
Day 1 to 4: cm per day.
Day 4 to 6: cm per day.
2462040xy321224
Answer → 7 and 12 cm per day: faster and faster
Check: , so the later secant is steeper.
Anna walks from home at 60 m/min. At the same moment Ben walks from school, 900 m away, towards home at 90 m/min. After how many minutes do they meet, and how far from home? Hard
246810300600900tdAB
Show solution
Every minute they come closer by m.
Time: min.
Anna has walked m.
24810600900td6360
Answer → after 6 minutes, 360 m from home
Check: Ben has walked m, and m.
Are you a teacher?

Start live lessons with these applications for your whole class. Free to try for one month.

Try it free

Fits these school years

IB (MYP, Diploma): MYP 1, MYP 2, MYP 3, MYP 4, Diploma, year 1

Cambridge International: Lower Secondary, stage 7, Lower Secondary, stage 8, Lower Secondary, stage 9, IGCSE, AS Level

Netherlands: Groep 7, Groep 8, Year 1, Year 2, Vmbo bb (years 3-4), Vmbo kb (years 3-4), Vmbo gt (years 3-4), Havo · Mathematics A, Year 3 (havo, vwo), Vwo · Mathematics C, Havo · Mathematics B, Vwo · Mathematics A, Vwo · Mathematics B

Türkiye (MEB): Year 8 (MEB), Year 9 (MEB), Year 10 (MEB), Year 12 (MEB)

England (GCSE, A Level): Year 7, Year 8, Year 9, Year 10 (GCSE), Year 11 (GCSE), Year 12 (A Level)

USA (Common Core): Grade 6, Grade 8, Algebra 1, Algebra 2

What the applications of this topic teach 7 applications

Filling bottles

  • Telling from a bottle's shape where the water rises fast or slowly
  • Matching a bottle to its height–time graph
  • Shaping a bottle so that its graph is a given graph

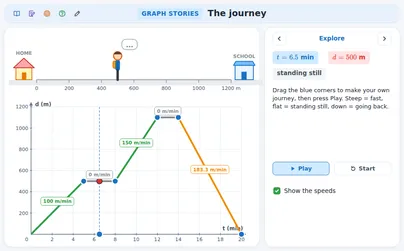
The journey: distance-time graphs

  • Reading distance and speed of a piece of a distance–time graph
  • Knowing that flat means standing still
  • Working out the average speed of a journey with a stop

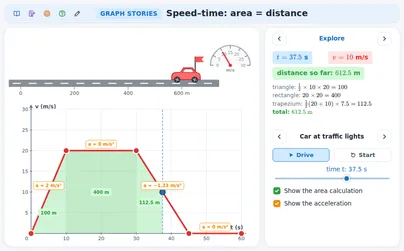
Speed-time graphs: area is distance

  • Reading the speed at any moment from a speed–time graph
  • Knowing that the steepness of a piece is the acceleration
  • Finding the distance as the area under the graph

Graph detective: key features

  • Finding the zeros, the sign and the highest and lowest points
  • Saying where a graph is increasing or decreasing
  • Describing a graph of a real situation with these features

Average rate of change

  • Working out the average rate of change between two points
  • Giving the unit of a rate: cm per day, euro per year
  • Telling if a graph grows faster, slower or steadily

Graphs in everyday life

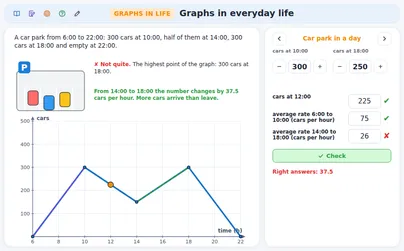
  • Reading graphs of everyday situations: a bike ride, a bath, a lift
  • Working out a speed or rate from the graph
  • Telling the shape of a graph from the story

Which graph fits? (puzzles)

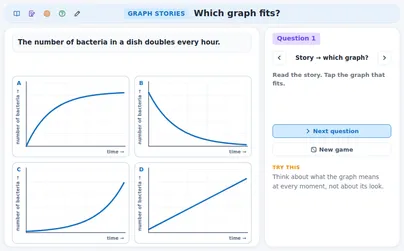
  • Matching a story to its graph and a graph to its story
  • Spotting classic mistakes: the graph as a picture of the road
  • Explaining why a wrong graph does not fit