Definition
The graphs of sin and cos
Both are waves between −1 and 1 that repeat every 360°. sin starts at 0 going up, cos starts at its top, 1.
Example
Highest and lowest point of sin:of cos:


Free applications open with a free student account. Teachers can use all applications in a live lesson.
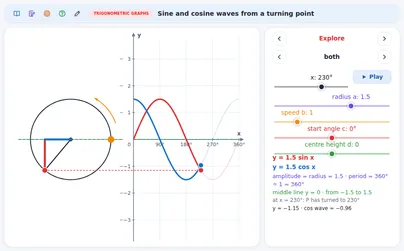 FreeSine and cosine waves from a turning point
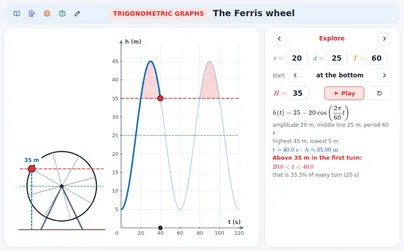 PlusThe Ferris wheel: a sinusoid from a ride
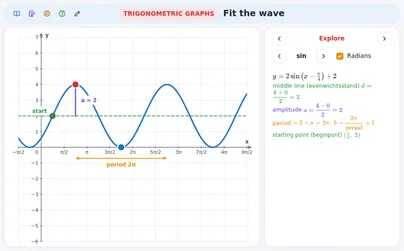 PlusFit the wave: amplitude, period, shift
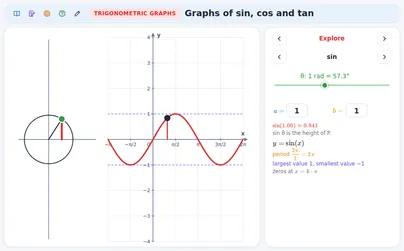 PlusGraphs of sin, cos and tan from the unit circle
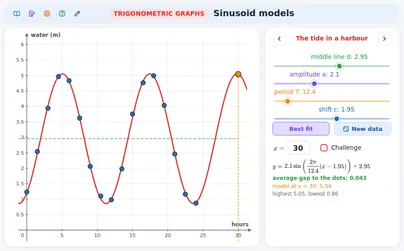 PlusSinusoid models: tides, daylight, temperature
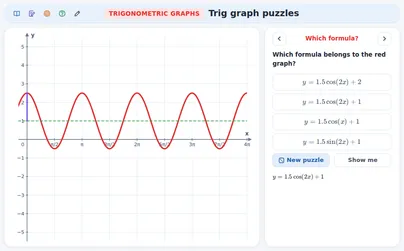 PlusTrig graph puzzles
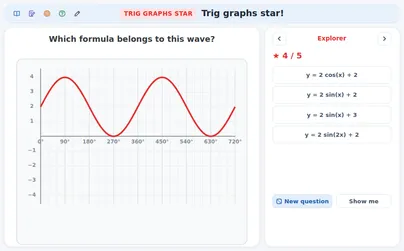 PlusTrig graphs star! (quiz)
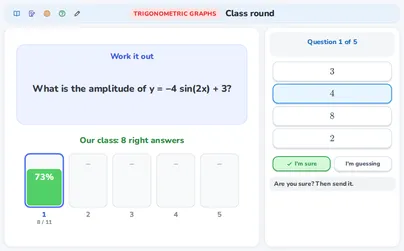 PlusClass round: the whole class at once
Start live lessons with these applications for your whole class. Free to try for one month.
Try it freeIB (MYP, Diploma): MYP 5, Diploma, year 1
Cambridge International: IGCSE, AS Level
Netherlands: Year 3 (havo, vwo), Vmbo kb (years 3-4), Vmbo gt (years 3-4), Havo · Mathematics B, Vwo · Mathematics A, Vwo · Mathematics B, Vwo · Mathematics C, Havo · Mathematics A
Türkiye (MEB): Year 11 (MEB)
England (GCSE, A Level): Year 11 (GCSE), Year 12 (A Level)
USA (Common Core): Algebra 2, Precalculus