Interactive Lessons

Reasoning with data

Branch 4
13topics20outcomes with applications55applications for MYP 4-5 Standard

Topics in this branch

← Back to the overview
4.3Graphs of data: scatter graphs, box plots and cumulative frequency graphsFully covered
4.3aLine plots
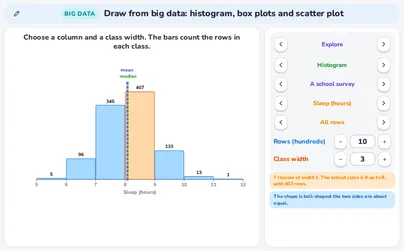
  1. 1Pupils create dot plots from a data set and interpret them, describing the shape, the clusters and the spread of the data.1
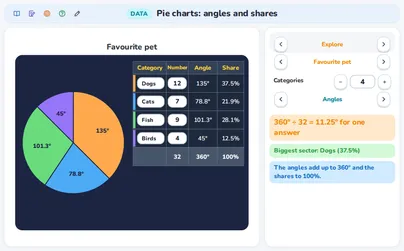
4.3bCircle graphs
  1. 1Pupils interpret circle graphs, reading the share of each category and comparing the sectors to answer questions about the data.1
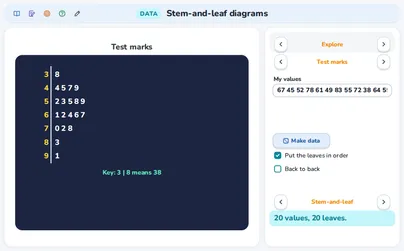
4.3cStem-and-leaf plots
  1. 1Pupils read stem-and-leaf plots and find the smallest and the largest value, the median and the mode from the display.1
← Back to the overview
4.11Probability with Venn diagrams, tree diagrams and sample spacesFully covered
4.11aProbability with diagrams and tables
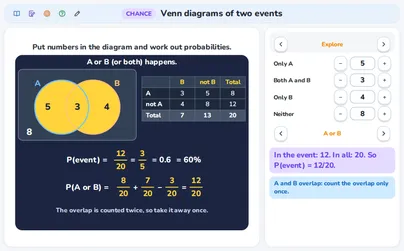
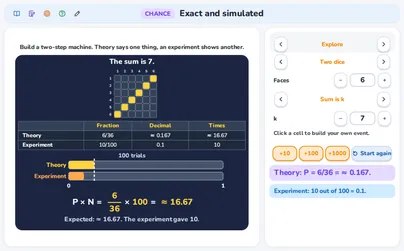
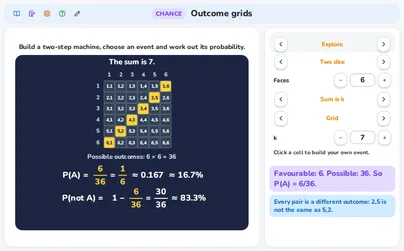
  1. 1Pupils calculate theoretical probabilities and show events with Venn diagrams, tree diagrams and lists of the sample space.2
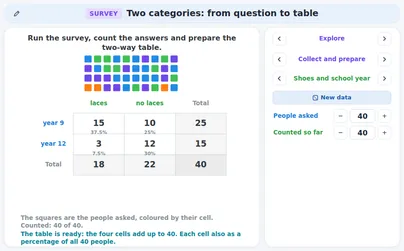
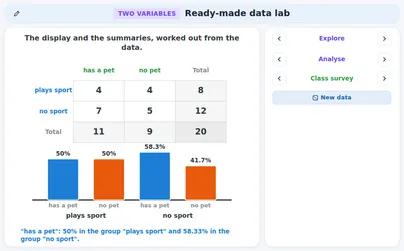
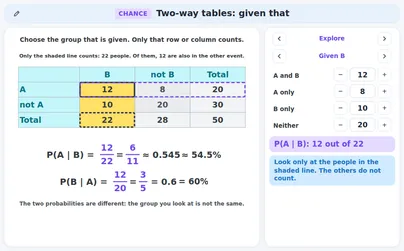
  2. 2Pupils find probabilities from two-way frequency tables, choosing the right row, column or total.1
Applications that cover the topic in general1

These applications belong to the topic as a whole, not to one outcome.

← Back to the overview
4.13Combined eventsFully covered
4.13aCompound events
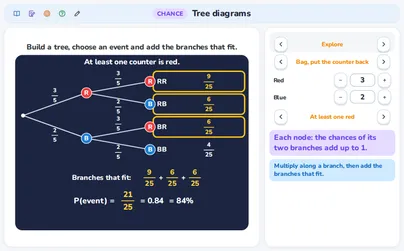
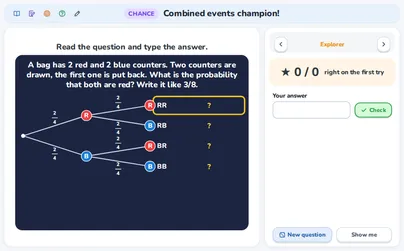
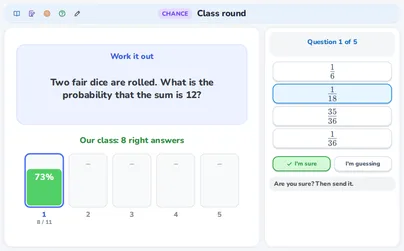
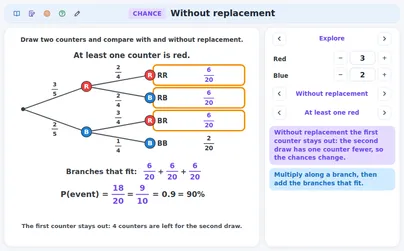
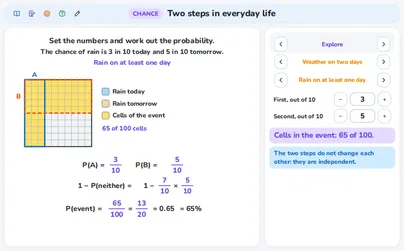
  1. 1Pupils list the outcomes of compound events and calculate their probabilities with tables and tree diagrams.9
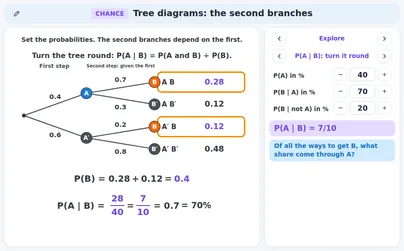
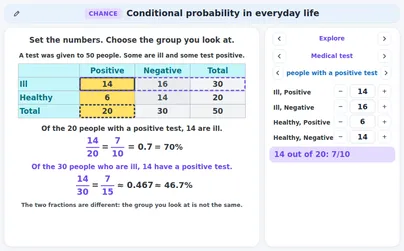
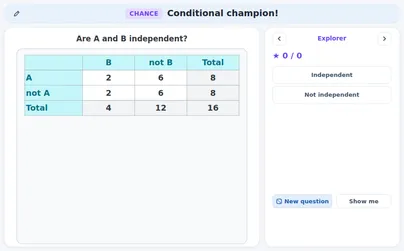
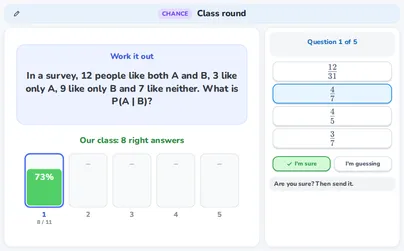
  2. 2Pupils find conditional probabilities from two-way frequency tables, where the sample space is limited to the given condition.4