Applications 5 applications
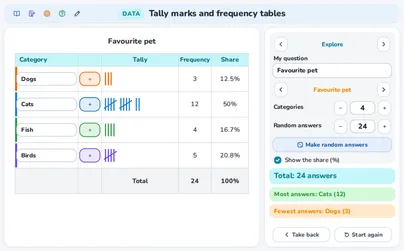 ExploreTally marks and frequency tablesMake your own survey, tally the answers in fives and build the frequency table with its total and shares.Open
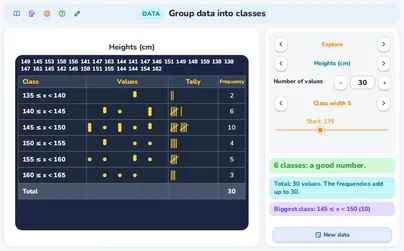 ExploreGroup data into classesGroup a data set into classes, change the width and the start, and see when the picture is too rough or the table too long.Open
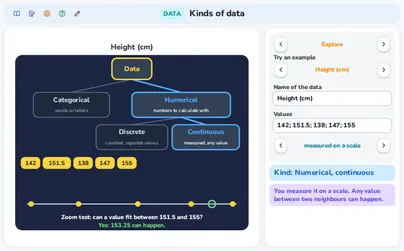 ExploreKinds of data: categorical, discrete, continuousSort data by kind with a decision tree: categorical, discrete or continuous, and test it with the zoom test.Open
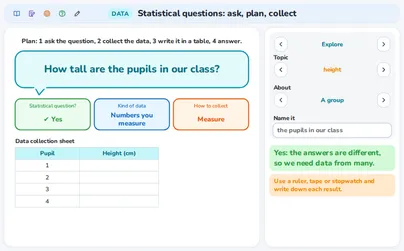 ExploreStatistical questions: ask, plan, collectAsk a question about one person or a group, and see if it is statistical, what kind of data it needs and how to collect them.Open
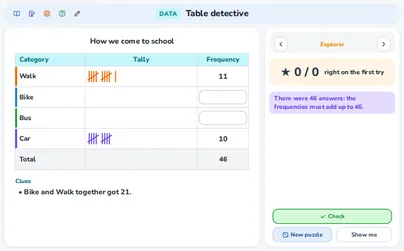 PracticeTable detectiveSolve table puzzles: find the empty boxes from the total and the clues.Open
Supporting applications 2 applications
Class round
Syllabus: p. 54