

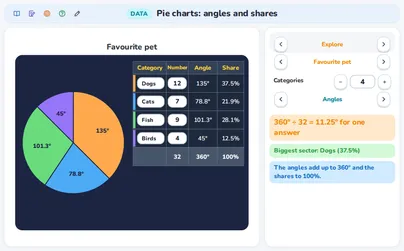
Pie charts: angles and shares Plus
This application is part of Plus
Plus opens all applications: € 4,99 per month or € 19,90 per year. Log in to your account; no account yet? Make a free one first, then you can look at Plus.
Are you a teacher? Teacher login
Your own teacher subscription already includes every application, Plus included — there is nothing extra to buy.
What this application teaches
- I can read a pie chart as fractions and percentages of a whole and compare the sectors; the angles make 360° and the shares 100%.
- I can work out the angle of a sector: number ÷ total × 360.
- I can go back from an angle and the total to the number and to the percentage.
- I know a pie chart only fits the parts of one whole, not a change over time.
- I can say why the percentages of a pie must add up to 100 and find the rest.
- I can colour a circle of ten equal parts for a description or a table: 40%, 30%, 20% and 10% are 4, 3, 2, 1 parts, and one part is a tenth of the circle: 10% and 36°.
- I can read a share as parts of ten without angles: 4 parts of ten is 40%, 3 parts of ten is 30%.
Fits these school years
IB (MYP, Diploma): MYP 1, MYP 2, MYP 3, PYP, MYP 4, MYP 5
Cambridge International: Lower Secondary, stage 7, Lower Secondary, stage 8, Lower Secondary, stage 9, Primary, stage 4, Primary, stage 5, Primary, stage 6
Netherlands: Year 2, Year 3 (havo, vwo), Groep 5, Groep 6, Groep 7, Year 1, Groep 8, Havo · Mathematics A, Vwo · Mathematics A, Vwo · Mathematics C, Vmbo bb (years 3-4), Vmbo kb (years 3-4), Vmbo gt (years 3-4)
Türkiye (MEB): Year 7 (MEB), Year 9 (MEB), Year 3 (MEB), Year 4 (MEB), Year 5 (MEB), Year 6 (MEB), Year 8 (MEB)
England (GCSE, A Level): Year 7, Year 8, Year 9, Year 10 (GCSE), Year 4, Year 5, Year 6
USA (Common Core): Grade 6, Grade 7, Grade 8, Grade 3, Grade 4, Grade 5
Similar applications
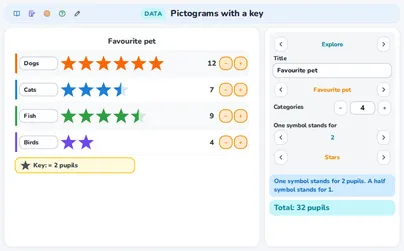 FreePictograms with a key
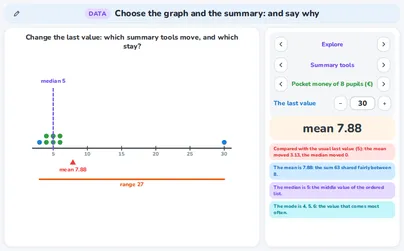 PlusChoose the graph and the summary: and say why
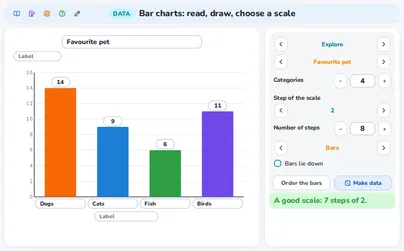 PlusBar charts: read, draw, choose a scale
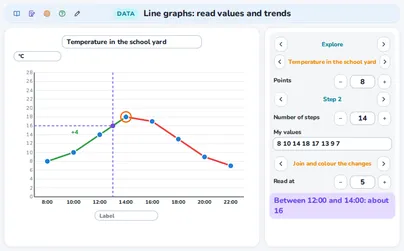 PlusLine graphs: read values and trends
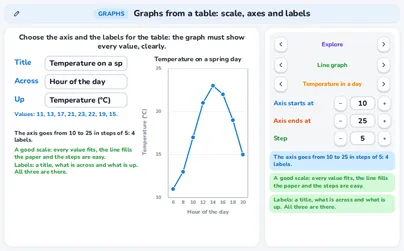 PlusGraphs from a table: scale, axes and labels
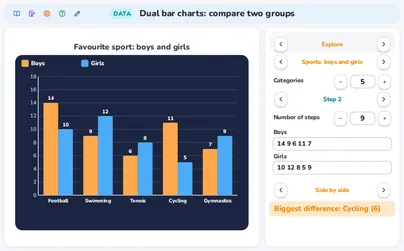 PlusDual bar charts: compare two groups
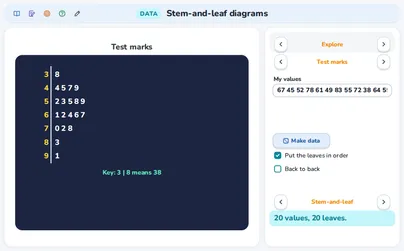 PlusStem-and-leaf diagrams
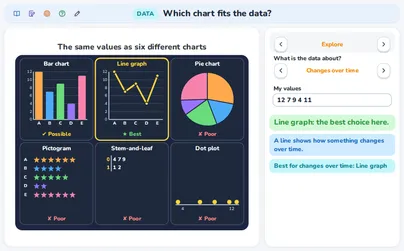 PlusWhich chart fits the data?
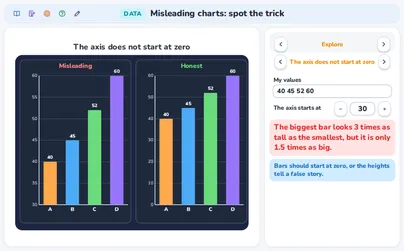 PlusMisleading charts: spot the trick
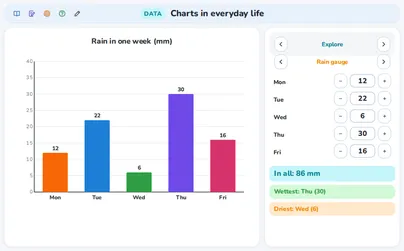 PlusCharts in everyday life
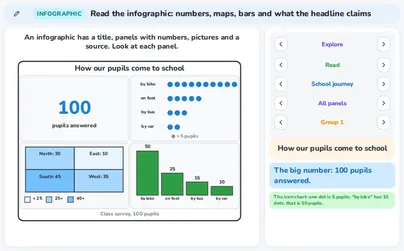 PlusRead the infographic: numbers, maps, bars and the headline