

Back to the lecture notes: Statistics with a computer: big data sets 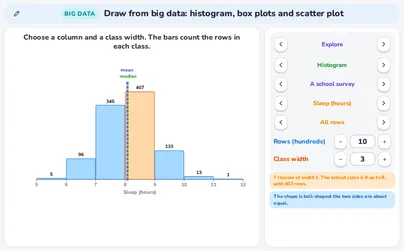
Draw from big data: histogram, box plots and scatter plot Plus
This application is part of Plus
Plus opens all applications: € 4,99 per month or € 19,90 per year. Log in to your account; no account yet? Make a free one first, then you can look at Plus.
Are you a teacher? Teacher login
Your own teacher subscription already includes every application, Plus included — there is nothing extra to buy.
What this application teaches
- I can read a histogram of a big column, choose a class width and name the shape.
- I can read box plots for all rows or for each group and find the outliers by the 1.5 × IQR rule.
- I can read a scatter plot with r and the line, and I know that a relation is not a cause.
- I can choose the chart that fits a question.
Fits these school years
IB (MYP, Diploma): Diploma, year 1, Diploma, year 2, MYP 5
Cambridge International: AS Level, A Level
Netherlands: Havo · Mathematics A, Vwo · Mathematics A, Vwo · Mathematics C
Türkiye (MEB): Year 12 (MEB)
England (GCSE, A Level): Year 12 (A Level), Year 13 (A Level)
USA (Common Core): Algebra 2, Precalculus
Similar applications
Read the lecture notes: Statistics with a computer: big data sets