Part
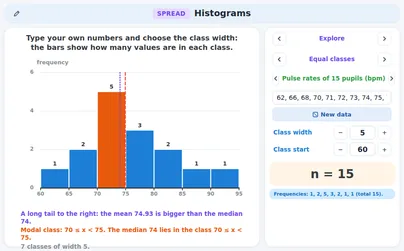
- a[Interpret diagrams for single-variable data, including understanding that area in a histogram represents frequency]
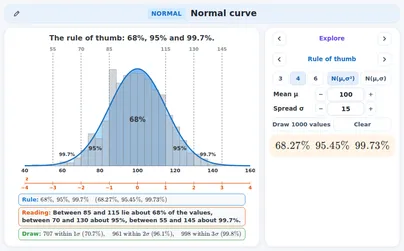
- b[Connect to probability distributions]
Applications 2 applications
Supporting applications 4 applications
DfE content: p. 14


DfE content: p. 14
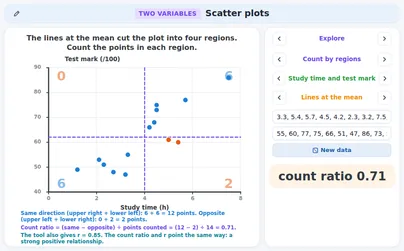 ExploreScatter plotsStart with a question and a plan, then look at your own pairs as a scatter plot and cut the plot into four regions.aOpen
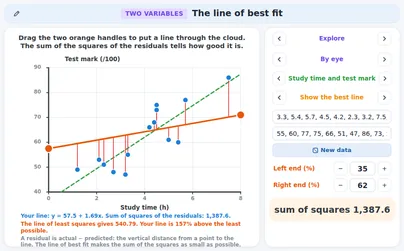 ExploreThe line of best fitDrag the two orange handles to draw your own line and see its sum of squares.aOpen
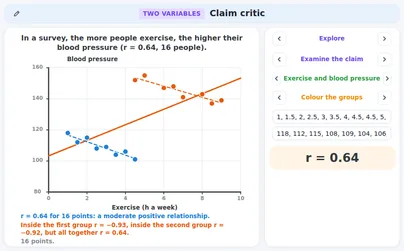 ExploreClaim criticNine claims that other people made, each with data you can open.a · cOpen
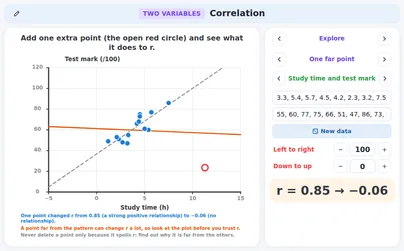 ExploreCorrelationDrag the points and watch r change, add one far point and see what it does, and look at data made for a chosen r.bOpen
DfE content: p. 14
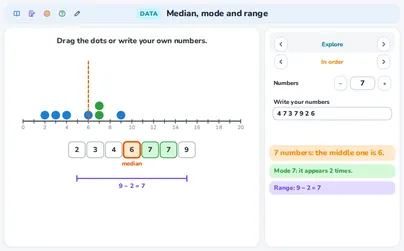 ExploreMedian, mode and rangePut dots on a number line and find the median, the mode and the range of your own numbers.Open
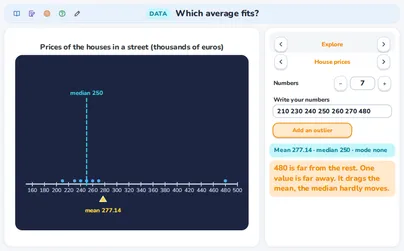 ExploreWhich average fits?Pick a situation, see the mean, the median and the mode live, add an outlier and decide which average is the fair one.Open
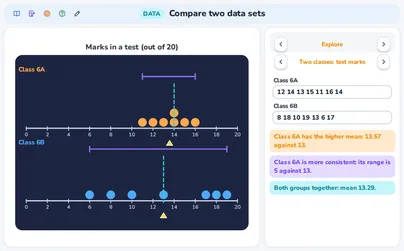 ExploreCompare two data setsPut two groups on two number lines, compare them and see the mean of both groups together.Open
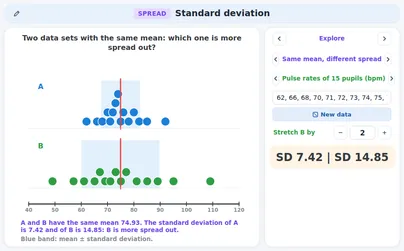 ExploreStandard deviationType your own numbers and see the band around the mean in which a value typically lies.aOpen
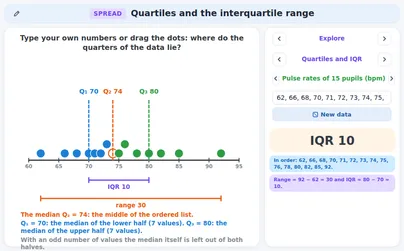 ExploreQuartiles and the interquartile rangeType your own numbers or drag the dots and see how the ordered data is cut into quarters.aOpen
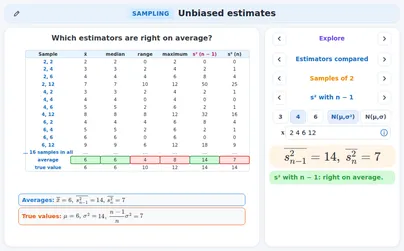 ExploreUnbiased estimates: mean and variance of a samplebOpen
DfE content: p. 14
ExploreWhich average fits?Pick a situation, see the mean, the median and the mode live, add an outlier and decide which average is the fair one.aOpen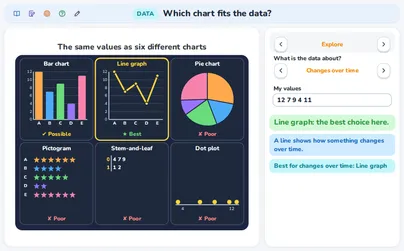 ExploreWhich chart fits the data?Say what your data is about and see your values drawn as six charts, each with a verdict and a reason.bOpen
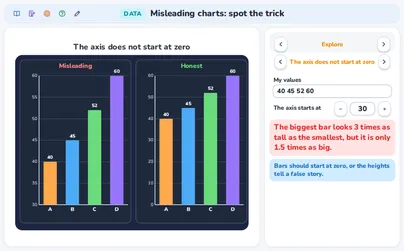 ExploreMisleading charts: spot the trickDraw your own values with a trick next to the honest chart and see how much bigger the trick makes things look.bOpenExploreQuartiles and the interquartile rangeType your own numbers or drag the dots and see how the ordered data is cut into quarters.aOpenExploreStandard deviationType your own numbers and see the band around the mean in which a value typically lies.aOpen
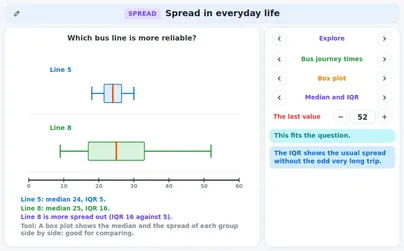 Everyday lifeSpread in everyday lifeFour real scenes.bOpen
The rest is completed as classroom work.
DfE content: p. 14