Enrichment
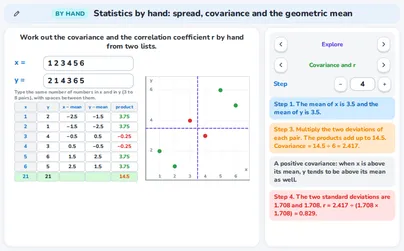
4.20aCalculating by hand
1Pupils calculate a standard deviation and a correlation coefficient by hand from a small data set, setting out the working in a table.1


Enrichment
Enrichment
No application yet for MYP 4-5 Extended. You teach this outcome in class.
No application yet for MYP 4-5 Extended. This topic is taught in class.
Enrichment
Enrichment
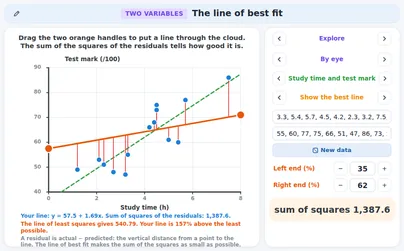 The line of best fitDrag the two orange handles to draw your own line and see its sum of squares.Open
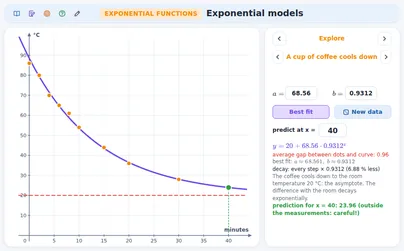 Exponential models: fit the dataExponential models: measurements of bacteria, a medicine in the blood or a cooling cup of coffee (or your own data).Open
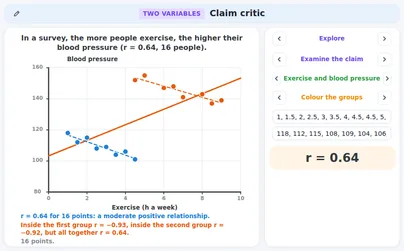 Claim criticNine claims that other people made, each with data you can open.Open
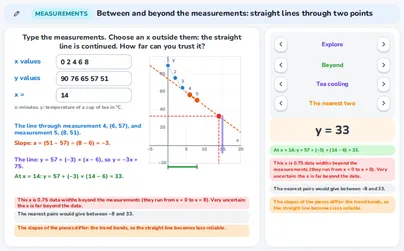 Between and beyond the measurements: straight lines through two pointsType a table of measurements and find the slope, a value between or beyond two neighbours, and how far you can trust an extrapolation.Open
Enrichment
Enrichment
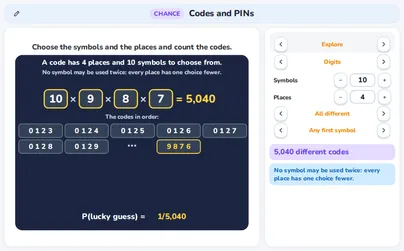 Codes and PINsChoose the symbols and the places of a code and count how many different codes there are.Open
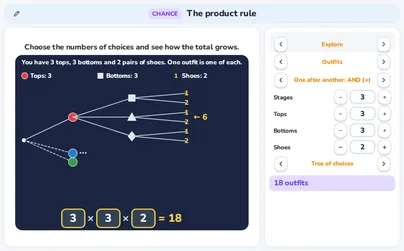 The product ruleChoose how many stages and choices there are and see why the numbers are multiplied or added.Open
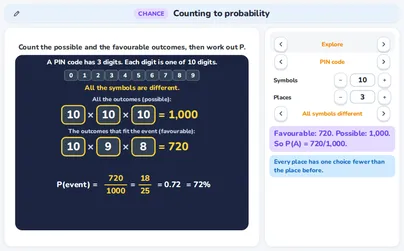 Counting to probabilityCount the outcomes of a code or a race and turn the counts into a probability.Open
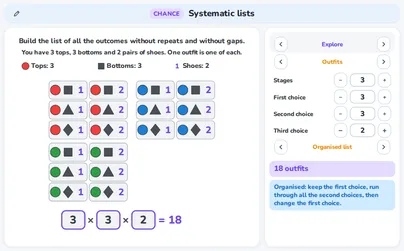 Systematic listsMake a list of all the choices, one after the other, and count them without missing any.Open
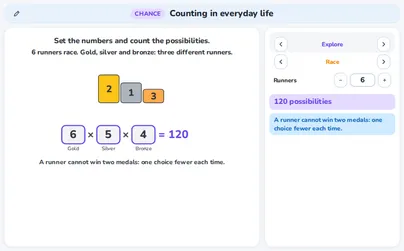 Counting in everyday lifePick a situation from life, set the numbers and count all the possibilities.Open
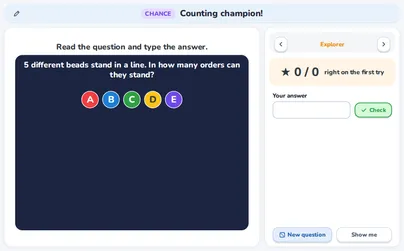 Counting champion! (quiz) QuizEndless practice with a score on the topic ‘Counting: lists, the product rule and arrangements’.Open
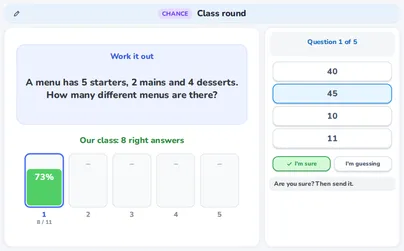 Class round: the whole class at once Class roundFive questions for the whole class at once: definitions, rules, true or myth, and sums.Open
Enrichment
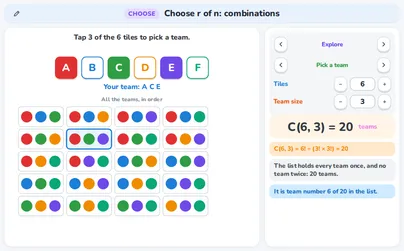 Choose r of n: combinationsLearn to count the teams when the order does not matter: pick tiles, link teams with line-ups and use the symmetry.Open
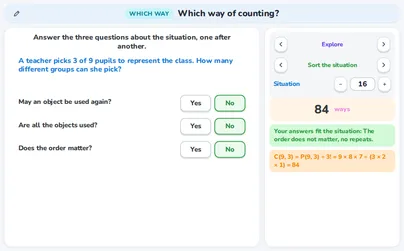 Which way of counting?Decide how to count before you calculate: answer three questions about 20 situations, and split a problem into cases or subtract the cases that do not fit.Open
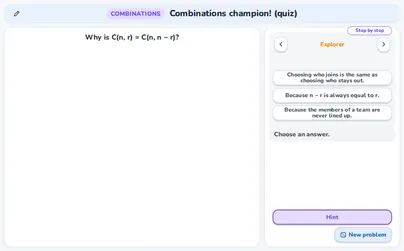 Combinations champion! (quiz) QuizEndless practice with a score on the topic ‘Counting: combinations, Pascal's triangle and routes’.Open
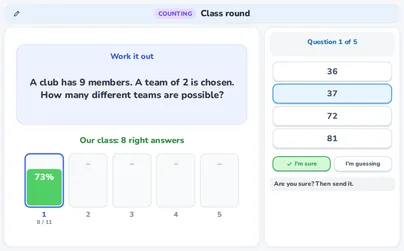 Class round: the whole class at once Class roundFive questions for the whole class at once: definitions, rules, true or myth, and sums.Open
Enrichment
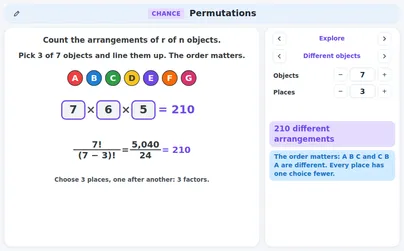 PermutationsCount the arrangements of objects chosen in order, and of the letters of a word.OpenCounting champion! (quiz) QuizEndless practice with a score on the topic ‘Counting: lists, the product rule and arrangements’.OpenClass round: the whole class at once Class roundFive questions for the whole class at once: definitions, rules, true or myth, and sums.Open
Enrichment
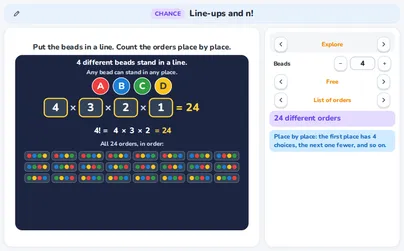 Line-ups and n!Put beads in a line and count in how many orders they can stand.OpenPermutationsCount the arrangements of objects chosen in order, and of the letters of a word.OpenCounting champion! (quiz) QuizEndless practice with a score on the topic ‘Counting: lists, the product rule and arrangements’.OpenClass round: the whole class at once Class roundFive questions for the whole class at once: definitions, rules, true or myth, and sums.Open
Enrichment
Enrichment